8. The graph shows the relationship between the United States dollar and the euro, the currency of the European Union, in December 2011. Part A: What is the constant of proportionality shown in the graph? Exchange Rate (December 6, 2011) (400, 300) 300 200 250, 187.50) 100 (120, 90) 100 200 300 400 Number of US dollars Your answer 8. The graph shows the relationship between the United States dollar and the euro, the currency of the European Union, in December 2011. Part B: Justify why the relationship shown in the graph is a proportional Number of euros


Equations and Inequations
Equations and inequalities describe the relationship between two mathematical expressions.
Linear Functions
A linear function can just be a constant, or it can be the constant multiplied with the variable like x or y. If the variables are of the form, x2, x1/2 or y2 it is not linear. The exponent over the variables should always be 1.
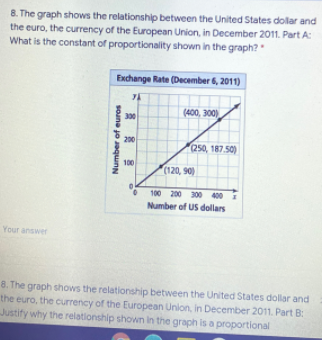
The graph shows the relationship between the United States dollar and the euro, the currency of the European Union, in December 2011.
Part A: What is the constant of proportionality shown in the graph? The graph shows the relationship between the United States dollar and the euro, the currency of the European Union, in December 2011.
Part B: justify why the relationship shown in the graph is a proportional relationship.


Trending now
This is a popular solution!

Step by step
Solved in 2 steps


