9) The scatterplot and the model describe the association between years and the numbers (in millions) of Americans witouth health insurance. Years versus Numbers of Uninsured Americans 2000 2002 2004 2006 2008 2010 2012 Year is the association positive, negative or neither? What does that mean in this situation? b points Use the linear model to estimate the number American uninsured in the year 2010 Find the actual number of uninsrued Americans in the year 2010 d) s] Is your linear model overestimating or understimating the number of American uninsured in 2010? Find the error Millions of people R$$49935 36
9) The scatterplot and the model describe the association between years and the numbers (in millions) of Americans witouth health insurance. Years versus Numbers of Uninsured Americans 2000 2002 2004 2006 2008 2010 2012 Year is the association positive, negative or neither? What does that mean in this situation? b points Use the linear model to estimate the number American uninsured in the year 2010 Find the actual number of uninsrued Americans in the year 2010 d) s] Is your linear model overestimating or understimating the number of American uninsured in 2010? Find the error Millions of people R$$49935 36

Big Ideas Math A Bridge To Success Algebra 1: Student Edition 2015
1st Edition
ISBN:9781680331141
Author:HOUGHTON MIFFLIN HARCOURT
Publisher:HOUGHTON MIFFLIN HARCOURT
Chapter11: Data Analysis And Displays
Section11.4: Two-ways Tables
Problem 28E

Related questions
Question
 answer questions below
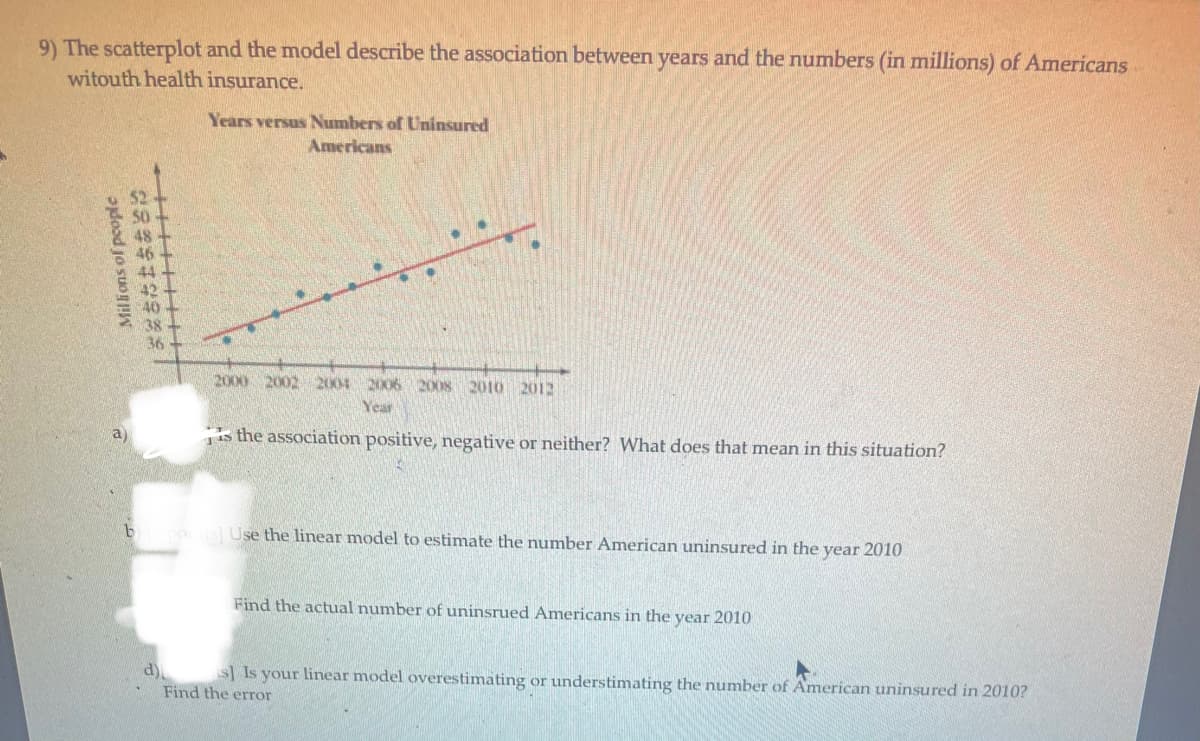
Transcribed Image Text:9) The scatterplot and the model describe the association between years and the numbers (in millions) of Americans
witouth health insurance.
Years versus Numbers of Uninsured
Americans
52
48
44
42
40
38
36
2000 2002 2004 2006 2008 2010 2012
Year
11s the association positive, negative or neither? What does that mean in this situation?
os Use the linear model to estimate the number American uninsured in the year 2010
Find the actual number of uninsrued Americans in the year 2010
d)
s Is your linear model overestimating or understimating the number of American uninsured in 2010?
Find the error
Milions of people
Expert Solution
This question has been solved!
Explore an expertly crafted, step-by-step solution for a thorough understanding of key concepts.

Step by step
Solved in 3 steps with 2 images

Recommended textbooks for you
Big Ideas Math A Bridge To Success Algebra 1: Stu…
Algebra
ISBN:
9781680331141
Author:
HOUGHTON MIFFLIN HARCOURT
Publisher:
Houghton Mifflin Harcourt
Big Ideas Math A Bridge To Success Algebra 1: Stu…
Algebra
ISBN:
9781680331141
Author:
HOUGHTON MIFFLIN HARCOURT
Publisher:
Houghton Mifflin Harcourt