9. Bank A and Bank B have each developed an improved process for serving customers. The waiting period from the moment a customer enters until he or she reaches the counter needs to be shortened. A random sample of 10 customers is selected from each bank and the results (in minutes) are shown in the accompanying data table. Complete parts (a) through (d). 12 Click the icon to view the table. a. Assuming that the population variances from both banks are equal, is there evidence of a difference in the mean waiting time between the two branches? (Use a = 0.05.) Determine the hypotheses. Let u, be the mean waiting time of bank A and u, be the waiting time of bank B. Choose the correct answer below. O A. Ho: H1 SH2 H;: H1> H2 B. Ho: H1 H2 OC. Ho: H1 2 H: H1
9. Bank A and Bank B have each developed an improved process for serving customers. The waiting period from the moment a customer enters until he or she reaches the counter needs to be shortened. A random sample of 10 customers is selected from each bank and the results (in minutes) are shown in the accompanying data table. Complete parts (a) through (d). 12 Click the icon to view the table. a. Assuming that the population variances from both banks are equal, is there evidence of a difference in the mean waiting time between the two branches? (Use a = 0.05.) Determine the hypotheses. Let u, be the mean waiting time of bank A and u, be the waiting time of bank B. Choose the correct answer below. O A. Ho: H1 SH2 H;: H1> H2 B. Ho: H1 H2 OC. Ho: H1 2 H: H1

Glencoe Algebra 1, Student Edition, 9780079039897, 0079039898, 2018
18th Edition
ISBN:9780079039897
Author:Carter
Publisher:Carter
Chapter10: Statistics
Section10.4: Distributions Of Data
Problem 19PFA

Related questions
Question
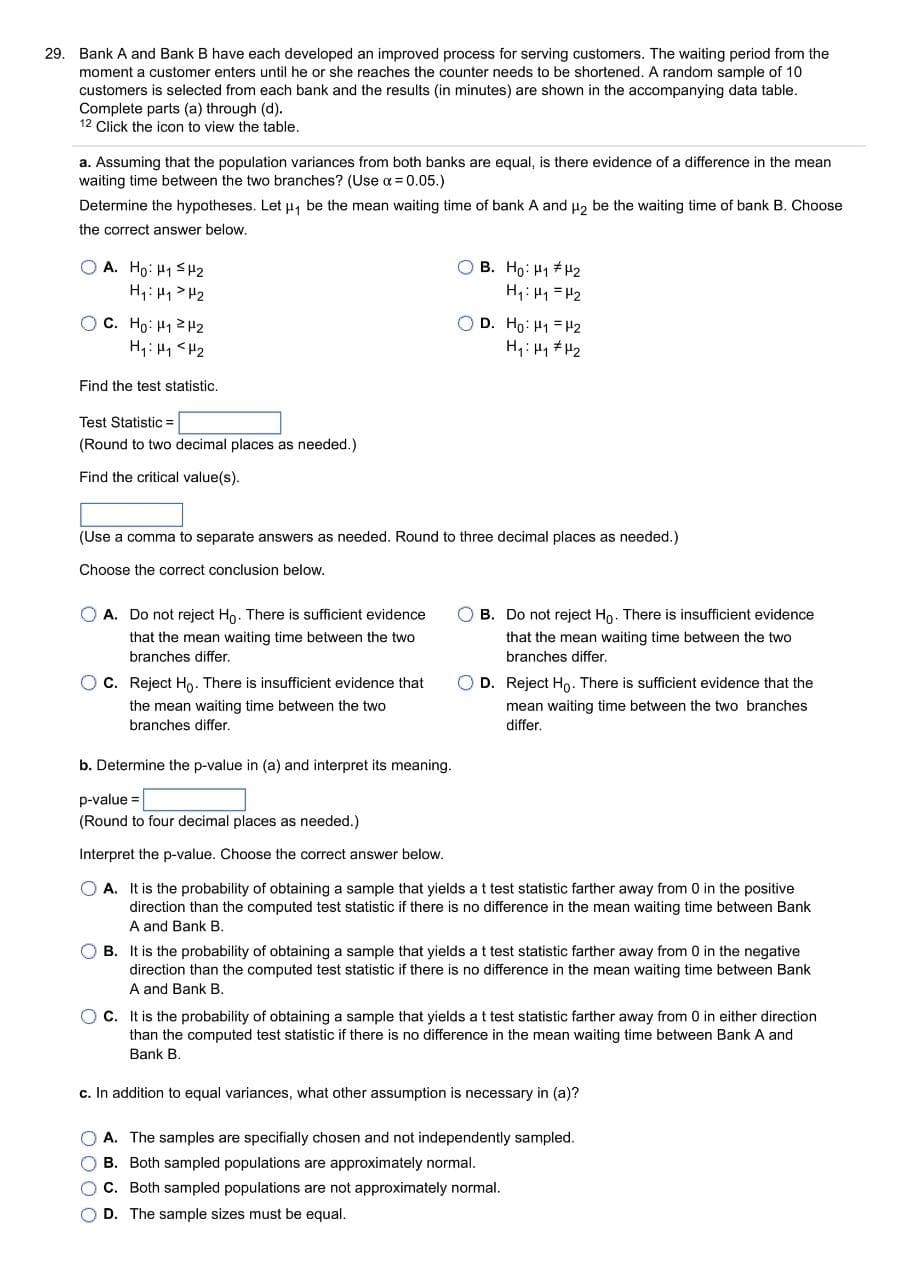
Transcribed Image Text:29. Bank A and Bank B have each developed an improved process for serving customers. The waiting period from the
moment a customer enters until he or she reaches the counter needs to be shortened. A random sample of 10
customers is selected from each bank and the results (in minutes) are shown in the accompanying data table.
Complete parts (a) through (d).
12 Click the icon to view the table.
a. Assuming that the population variances from both banks are equal, is there evidence of a difference in the mean
waiting time between the two branches? (Use a = 0.05.)
Determine the hypotheses. Let u, be the mean waiting time of bank A and µ, be the waiting time of bank B. Choose
the correct answer below.
O A. Ho: H1S H2
H: H1 > H2
O B. Ho: H1 #H2
H: H1 =H2
OC. Ho: H1 2H2
H,: H1 <H2
O D. Ho: H1 = H2
H,: H1 # H2
Find the test statistic.
Test Statistic =
(Round to two decimal places as needed.)
Find the critical value(s).
(Use a comma to separate answers as needed. Round to three decimal places as needed.)
Choose the correct conclusion below.
O A. Do not reject Ho. There is sufficient evidence
O B. Do not reject Ho. There is insufficient evidence
that the mean waiting time between the two
that the mean waiting time between the two
branches differ.
branches differ.
O C. Reject Ho. There is insufficient evidence that
O D. Reject Ho. There is sufficient evidence that the
the mean waiting time between the two
mean waiting time between the two branches
differ,
branches differ.
b. Determine the p-value in (a) and interpret its meaning.
p-value =
(Round to four decimal places as needed.)
Interpret the p-value. Choose the correct answer below.
A. It is the probability of obtaining a sample that yields a t test statistic farther away from 0 in the positive
direction than the computed test statistic if there is no difference in the mean waiting time between Bank
A and Bank B.
B. It is the probability of obtaining a sample that yields at test statistic farther away from 0 in the negative
direction than the computed test statistic if there is no difference in the mean waiting time between Bank
A and Bank B.
C. It is the probability of obtaining a sample that yields a t test statistic farther away from 0 in either direction
than the computed test statistic if there is no difference in the mean waiting time between Bank A and
Bank B.
c. In addition to equal variances, what other assumption is necessary in (a)?
O A. The samples are specifially chosen and not independently sampled.
O B. Both sampled populations are approximately normal.
C. Both sampled populations are not approximately normal.
O D. The sample sizes must be equal.

Transcribed Image Text:d. Suppose that we were now informed that the standard deviation for both Banks is known:
Bank A std. dev. =1.3 and Bank B std. dev. = 2.3! This permits us to perform a Z-test for the difference of the 2
means. In this case, the Z-statistic would be
12: Data Table
Bank A
Bank B
2.57
3.96
2.58
4.55
3.32
4.59
3.77
5.43
3.36
5.93
4.17
6.59
4.74
6.34
4.27
7.29
5.44
8.39
5.95
10.51
Expert Solution
This question has been solved!
Explore an expertly crafted, step-by-step solution for a thorough understanding of key concepts.

This is a popular solution!

Trending now
This is a popular solution!

Step by step
Solved in 6 steps with 4 images

Recommended textbooks for you
Glencoe Algebra 1, Student Edition, 9780079039897…
Algebra
ISBN:
9780079039897
Author:
Carter
Publisher:
McGraw Hill
Glencoe Algebra 1, Student Edition, 9780079039897…
Algebra
ISBN:
9780079039897
Author:
Carter
Publisher:
McGraw Hill