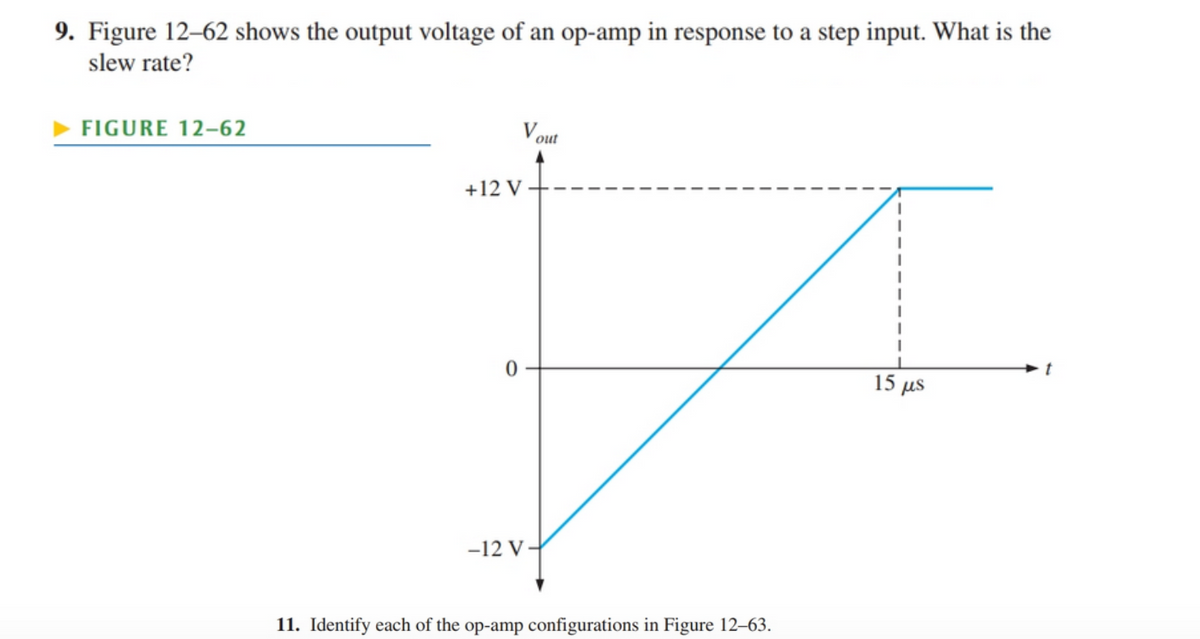
9. Figure 12–62 shows the output voltage of an op-amp in response to a step input. What is the slew rate? FIGURE 12-62 V out +12 V 15 µs -12 V – 11. Identify each of the op-amp configurations in Figure 12–63.
9. Figure 12–62 shows the output voltage of an op-amp in response to a step input. What is the slew rate? FIGURE 12-62 V out +12 V 15 µs -12 V – 11. Identify each of the op-amp configurations in Figure 12–63.

Delmar's Standard Textbook Of Electricity
7th Edition
ISBN:9781337900348
Author:Stephen L. Herman
Publisher:Stephen L. Herman
Chapter18: Resistive-inductive Parallel Circuits
Section: Chapter Questions
Problem 6RQ: 6. In the circuit shown in Figure 18-1, the resistor has a current flow of 6.5 A and the inductor...

Related questions
Question
Transcribed Image Text:9. Figure 12–62 shows the output voltage of an op-amp in response to a step input. What is the
slew rate?
V out
FIGURE 12–62
+12 V -
15 μ
-12 V-
11. Identify each of the op-amp configurations in Figure 12–63.
Expert Solution
This question has been solved!
Explore an expertly crafted, step-by-step solution for a thorough understanding of key concepts.

This is a popular solution!

Trending now
This is a popular solution!

Step by step
Solved in 2 steps with 1 images

Knowledge Booster


Learn more about
Need a deep-dive on the concept behind this application? Look no further. Learn more about this topic, electrical-engineering and related others by exploring similar questions and additional content below.Recommended textbooks for you
Delmar's Standard Textbook Of Electricity
Electrical Engineering
ISBN:
9781337900348
Author:
Stephen L. Herman
Publisher:
Cengage Learning
Delmar's Standard Textbook Of Electricity
Electrical Engineering
ISBN:
9781337900348
Author:
Stephen L. Herman
Publisher:
Cengage Learning