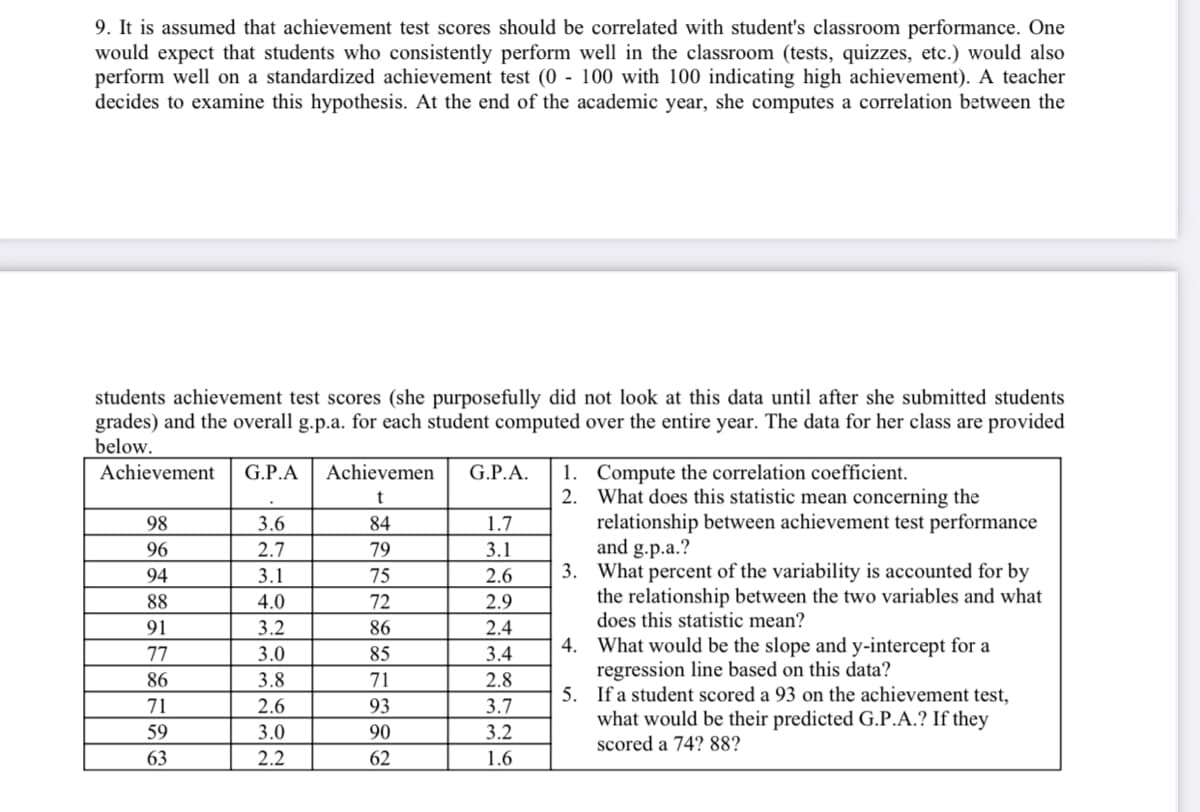
9. It is assumed that achievement test scores should be correlated with student's classroom performance. One would expect that students who consistently perform well in the classroom (tests, quizzes, etc.) would also perform well on a standardized achievement test (0 - 100 with 100 indicating high achievement). A teacher decides to examine this hypothesis. At the end of the academic year, she computes a correlation between the students achievement test scores (she purposefully did not look at this data until after she submitted students grades) and the overall g.p.a. for each student computed over the entire year. The data for her class are provided below. 1. Compute the correlation coefficient. 2. What does this statistic mean concerning the relationship between achievement test performance and g.p.a.? 3. What percent of the variability is accounted for by the relationship between the two variables and what does this statistic mean? Achievement G.P.A Achievemen G.P.A. 98 3.6 84 1.7 96 2.7 79 3.1 94 3.1 75 2.6 88 4.0 72 2.9 91 3.2 86 2.4 4. What would be the slope and y-intercept for a regression line based on this data? 5. If a student scored a 93 on the achievement test, what would be their predicted G.P.A.? If they 77 3.0 85 3.4 86 3.8 71 2.8 71 2.6 93 3.7 59 3.0 90 3.2 scored a 74? 88? 63 2.2 62 1.6
9. It is assumed that achievement test scores should be correlated with student's classroom performance. One would expect that students who consistently perform well in the classroom (tests, quizzes, etc.) would also perform well on a standardized achievement test (0 - 100 with 100 indicating high achievement). A teacher decides to examine this hypothesis. At the end of the academic year, she computes a correlation between the students achievement test scores (she purposefully did not look at this data until after she submitted students grades) and the overall g.p.a. for each student computed over the entire year. The data for her class are provided below. 1. Compute the correlation coefficient. 2. What does this statistic mean concerning the relationship between achievement test performance and g.p.a.? 3. What percent of the variability is accounted for by the relationship between the two variables and what does this statistic mean? Achievement G.P.A Achievemen G.P.A. 98 3.6 84 1.7 96 2.7 79 3.1 94 3.1 75 2.6 88 4.0 72 2.9 91 3.2 86 2.4 4. What would be the slope and y-intercept for a regression line based on this data? 5. If a student scored a 93 on the achievement test, what would be their predicted G.P.A.? If they 77 3.0 85 3.4 86 3.8 71 2.8 71 2.6 93 3.7 59 3.0 90 3.2 scored a 74? 88? 63 2.2 62 1.6

Glencoe Algebra 1, Student Edition, 9780079039897, 0079039898, 2018
18th Edition
ISBN:9780079039897
Author:Carter
Publisher:Carter
Chapter10: Statistics
Section10.3: Measures Of Spread
Problem 1GP

Related questions
Question
Please see attached doc for the problem to be solved. Thanks.
Transcribed Image Text:9. It is assumed that achievement test scores should be correlated with student's classroom performance. One
would expect that students who consistently perform well in the classroom (tests, quizzes, etc.) would also
perform well on a standardized achievement test (0 - 100 with 100 indicating high achievement). A teacher
decides to examine this hypothesis. At the end of the academic year, she computes a correlation between the
students achievement test scores (she purposefully did not look at this data until after she submitted students
grades) and the overall g.p.a. for each student computed over the entire year. The data for her class are provided
below.
1. Compute the correlation coefficient.
2. What does this statistic mean concerning the
relationship between achievement test performance
and g.p.a.?
3. What percent of the variability is accounted for by
the relationship between the two variables and what
does this statistic mean?
Achievement
G.P.A
Achievemen
G.P.A.
98
3.6
84
1.7
96
2.7
79
3.1
94
3.1
75
2.6
88
4.0
72
2.9
91
3.2
86
2.4
4. What would be the slope and y-intercept for a
regression line based on this data?
5. If a student scored a 93 on the achievement test,
what would be their predicted G.P.A.? If they
77
3.0
85
3.4
86
3.8
71
2.8
71
2.6
93
3.7
59
3.0
90
3.2
scored a 74? 88?
63
2.2
62
1.6
Expert Solution
This question has been solved!
Explore an expertly crafted, step-by-step solution for a thorough understanding of key concepts.

This is a popular solution!

Trending now
This is a popular solution!

Step by step
Solved in 2 steps with 1 images

Recommended textbooks for you
Glencoe Algebra 1, Student Edition, 9780079039897…
Algebra
ISBN:
9780079039897
Author:
Carter
Publisher:
McGraw Hill
Glencoe Algebra 1, Student Edition, 9780079039897…
Algebra
ISBN:
9780079039897
Author:
Carter
Publisher:
McGraw Hill