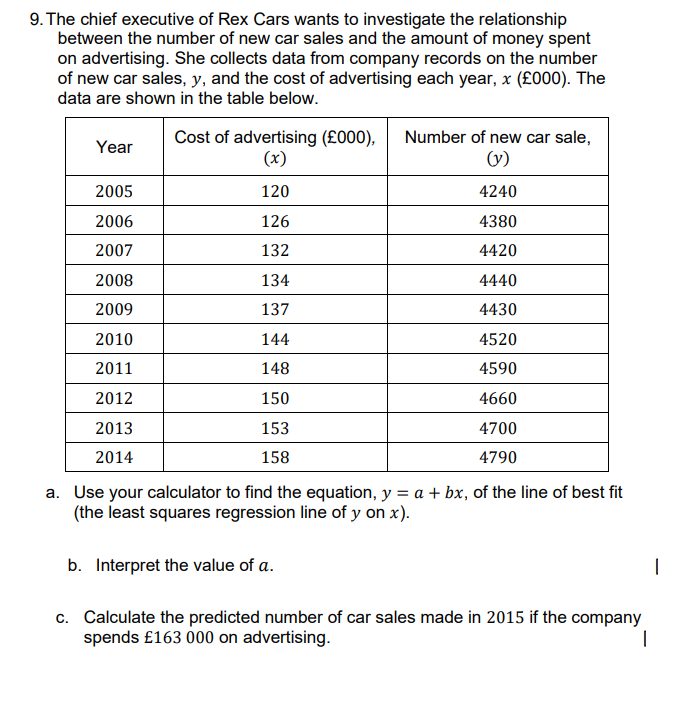
9. The chief executive of Rex Cars wants to investigate the relationship between the number of new car sales and the amount of money spent on advertising. She collects data from company records on the number of new car sales, y, and the cost of advertising each year, x (£000). The data are shown in the table below. Cost of advertising (£000), (x) Number of new car sale, (y) Year 2005 120 4240 2006 126 4380 2007 132 4420 2008 134 4440 2009 137 4430 2010 144 4520 2011 148 4590 2012 150 4660 2013 153 4700 2014 158 4790 a. Use your calculator to find the equation, y = a + bx, of the line of best fit (the least squares regression line of y on x). b. Interpret the value of a. c. Calculate the predicted number of car sales made in 2015 if the company spends £163 000 on advertising. |
9. The chief executive of Rex Cars wants to investigate the relationship between the number of new car sales and the amount of money spent on advertising. She collects data from company records on the number of new car sales, y, and the cost of advertising each year, x (£000). The data are shown in the table below. Cost of advertising (£000), (x) Number of new car sale, (y) Year 2005 120 4240 2006 126 4380 2007 132 4420 2008 134 4440 2009 137 4430 2010 144 4520 2011 148 4590 2012 150 4660 2013 153 4700 2014 158 4790 a. Use your calculator to find the equation, y = a + bx, of the line of best fit (the least squares regression line of y on x). b. Interpret the value of a. c. Calculate the predicted number of car sales made in 2015 if the company spends £163 000 on advertising. |

Glencoe Algebra 1, Student Edition, 9780079039897, 0079039898, 2018
18th Edition
ISBN:9780079039897
Author:Carter
Publisher:Carter
Chapter2: Linear Equations
Section: Chapter Questions
Problem 2PFA

Related questions
Question
Transcribed Image Text:9. The chief executive of Rex Cars wants to investigate the relationship
between the number of new car sales and the amount of money spent
on advertising. She collects data from company records on the number
of new car sales, y, and the cost of advertising each year, x (£000). The
data are shown in the table below.
Cost of advertising (£000),
(x)
Number of new car sale,
Year
(y)
2005
120
4240
2006
126
4380
2007
132
4420
2008
134
4440
2009
137
4430
2010
144
4520
2011
148
4590
2012
150
4660
2013
153
4700
2014
158
4790
a. Use your calculator to find the equation, y = a + bx, of the line of best fit
(the least squares regression line of y on x).
b. Interpret the value of a.
c. Calculate the predicted number of car sales made in 2015 if the company
spends £163 000 on advertising.
Expert Solution
This question has been solved!
Explore an expertly crafted, step-by-step solution for a thorough understanding of key concepts.

Step by step
Solved in 4 steps with 2 images

Recommended textbooks for you
Glencoe Algebra 1, Student Edition, 9780079039897…
Algebra
ISBN:
9780079039897
Author:
Carter
Publisher:
McGraw Hill

Algebra: Structure And Method, Book 1
Algebra
ISBN:
9780395977224
Author:
Richard G. Brown, Mary P. Dolciani, Robert H. Sorgenfrey, William L. Cole
Publisher:
McDougal Littell

Elementary Algebra
Algebra
ISBN:
9780998625713
Author:
Lynn Marecek, MaryAnne Anthony-Smith
Publisher:
OpenStax - Rice University
Glencoe Algebra 1, Student Edition, 9780079039897…
Algebra
ISBN:
9780079039897
Author:
Carter
Publisher:
McGraw Hill
Algebra: Structure And Method, Book 1
Algebra
ISBN:
9780395977224
Author:
Richard G. Brown, Mary P. Dolciani, Robert H. Sorgenfrey, William L. Cole
Publisher:
McDougal Littell
Elementary Algebra
Algebra
ISBN:
9780998625713
Author:
Lynn Marecek, MaryAnne Anthony-Smith
Publisher:
OpenStax - Rice University

Algebra & Trigonometry with Analytic Geometry
Algebra
ISBN:
9781133382119
Author:
Swokowski
Publisher:
Cengage