9. The principal at a local high school asked 100 randomly selected students how many minutes they spend completing homework each night of the week. The mean time students in the sample spent on homework each night was 72.5 minutes. Assume the population mean time spent on homework each night is 81.2 minutes. Which of the following is the correct representation of the mean time spent on homework for the 100 randomly selected students in the sample and the population of students at the school? a. b. C. = 72.5 minutes and = 81.2 minutes, both are parameters. = 72.5 minutes and = 81.2 minutes, 72.5 is a parameter, but 81.2 is a statistic. = 72.5 minutes and 4= 81.2 minutes. 72.5 is a statistic but 81 ? is a parameter
9. The principal at a local high school asked 100 randomly selected students how many minutes they spend completing homework each night of the week. The mean time students in the sample spent on homework each night was 72.5 minutes. Assume the population mean time spent on homework each night is 81.2 minutes. Which of the following is the correct representation of the mean time spent on homework for the 100 randomly selected students in the sample and the population of students at the school? a. b. C. = 72.5 minutes and = 81.2 minutes, both are parameters. = 72.5 minutes and = 81.2 minutes, 72.5 is a parameter, but 81.2 is a statistic. = 72.5 minutes and 4= 81.2 minutes. 72.5 is a statistic but 81 ? is a parameter

Glencoe Algebra 1, Student Edition, 9780079039897, 0079039898, 2018
18th Edition
ISBN:9780079039897
Author:Carter
Publisher:Carter
Chapter10: Statistics
Section10.5: Comparing Sets Of Data
Problem 26PFA

Related questions
Question
Number 9
Transcribed Image Text:h
Name:
10.
9.
a.
b.
C.
d.
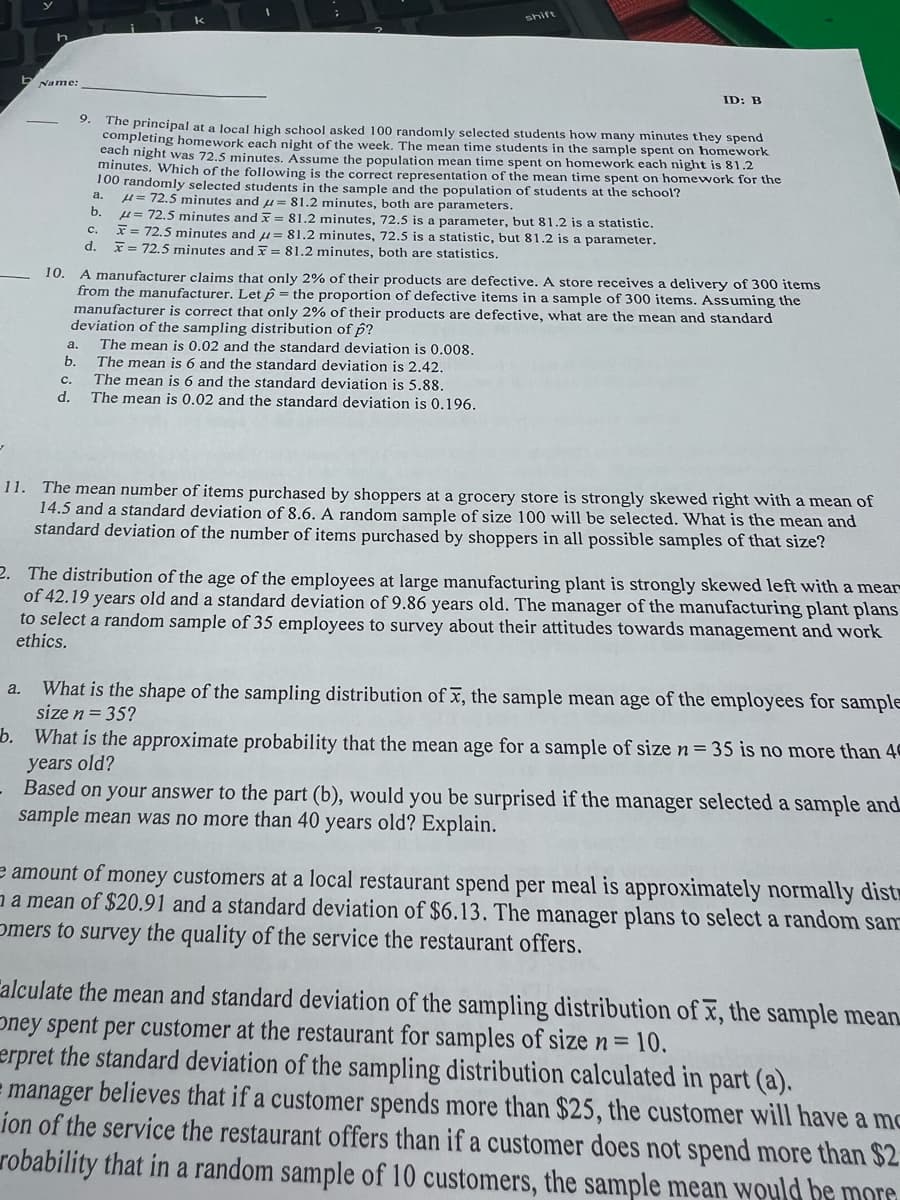
The principal at a local high school asked 100 randomly selected students how many minutes they spend
completing homework each night of the week. The mean time students in the sample spent on homework
each night was 72.5 minutes. Assume the population mean time spent on homework each night is 81.2
minutes. Which of the following is the correct representation of the mean time spent on homework for the
100 randomly selected students in the sample and the population of students at the school?
a. μ= 72.5 minutes and = 81.2 minutes, both are parameters.
b.
C.
d.
A manufacturer claims that only 2% of their products are defective. A store receives a delivery of 300 items
from the manufacturer. Let p = the proportion of defective items in a sample of 300 items. Assuming the
manufacturer is correct that only 2% of their products are defective, what are the mean and standard
deviation of the sampling distribution of p?
The mean is 0.02 and the standard deviation is 0.008.
The mean is 6 and the standard deviation is 2.42.
The mean is 6 and the standard deviation is 5.88.
The mean is 0.02 and the standard deviation is 0.196.
ID: B
= 72.5 minutes and x = 81.2 minutes, 72.5 is a parameter, but 81.2 is a statistic.
x = 72.5 minutes and = 81.2 minutes, 72.5 is a statistic, but 81.2 is a parameter.
x = 72.5 minutes and = 81.2 minutes, both are statistics.
11. The mean number of items purchased by shoppers at a grocery store is strongly skewed right with a mean of
14.5 and a standard deviation of 8.6. A random sample of size 100 will be selected. What is the mean and
standard deviation of the number of items purchased by shoppers in all possible samples of that size?
2. The distribution of the age of the employees at large manufacturing plant is strongly skewed left with a mear
of 42.19 years old and a standard deviation of 9.86 years old. The manager of the manufacturing plant plans
to select a random sample of 35 employees to survey about their attitudes towards management and work
ethics.
a. What is the shape of the sampling distribution of x, the sample mean age of the employees for sample
size n = 35?
b. What is the approximate probability that the mean age for a sample of size n = 35 is no more than 40
years old?
Based on your answer to the part (b), would you be surprised if the manager selected a sample and
sample mean was no more than 40 years old? Explain.
e amount of money customers at a local restaurant spend per meal is approximately normally dist
a mean of $20.91 and a standard deviation of $6.13. The manager plans to select a random san
Omers to survey the quality of the service the restaurant offers.
Calculate the mean and standard deviation of the sampling distribution of x, the sample mean
Oney spent per customer at the restaurant for samples of size n = 10.
erpret the standard deviation of the sampling distribution calculated in part (a).
= manager believes that if a customer spends more than $25, the customer will have a mo
ion of the service the restaurant offers than if a customer does not spend more than $2
robability that in a random sample of 10 customers, the sample mean would be mora
Expert Solution
This question has been solved!
Explore an expertly crafted, step-by-step solution for a thorough understanding of key concepts.

This is a popular solution!

Trending now
This is a popular solution!

Step by step
Solved in 2 steps

Recommended textbooks for you
Glencoe Algebra 1, Student Edition, 9780079039897…
Algebra
ISBN:
9780079039897
Author:
Carter
Publisher:
McGraw Hill

Big Ideas Math A Bridge To Success Algebra 1: Stu…
Algebra
ISBN:
9781680331141
Author:
HOUGHTON MIFFLIN HARCOURT
Publisher:
Houghton Mifflin Harcourt

Glencoe Algebra 1, Student Edition, 9780079039897…
Algebra
ISBN:
9780079039897
Author:
Carter
Publisher:
McGraw Hill
Big Ideas Math A Bridge To Success Algebra 1: Stu…
Algebra
ISBN:
9781680331141
Author:
HOUGHTON MIFFLIN HARCOURT
Publisher:
Houghton Mifflin Harcourt

College Algebra (MindTap Course List)
Algebra
ISBN:
9781305652231
Author:
R. David Gustafson, Jeff Hughes
Publisher:
Cengage Learning