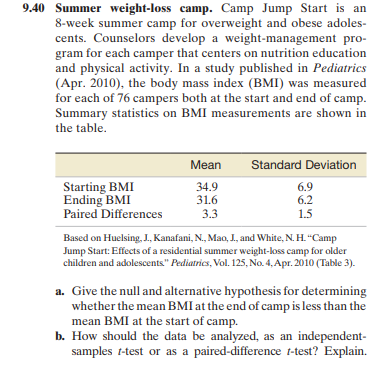
9.40 Summer weight-loss camp. Camp Jump Start is an 8-week summer camp for overweight and obese adoles- cents. Counselors develop a weight-management pro- gram for each camper that centers on nutrition education and physical activity. In a study published in Pediatrics (Apr. 2010), the body mass index (BMI) was measured for each of 76 campers both at the start and end of camp. Summary statistics on BMI measurements are shown in the table. Starting BMI Ending BMI Paired Differences Mean 34.9 31.6 3.3 Standard Deviation 6.9 6.2 1.5 Based on Huelsing, J., Kanafani, N., Mao, J., and White, N. H. "Camp Jump Start: Effects of a residential summer weight-loss camp for older children and adolescents." Pediatrics, Vol. 125, No. 4, Apr. 2010 (Table 3). a. Give the null and alternative hypothesis for determining whether the mean BMI at the end of camp is less than the mean BMI at the start of camp. b. How should the data be analyzed, as an independent- samples 1-test or as a paired-difference 1-test? Explain.
9.40 Summer weight-loss camp. Camp Jump Start is an 8-week summer camp for overweight and obese adoles- cents. Counselors develop a weight-management pro- gram for each camper that centers on nutrition education and physical activity. In a study published in Pediatrics (Apr. 2010), the body mass index (BMI) was measured for each of 76 campers both at the start and end of camp. Summary statistics on BMI measurements are shown in the table. Starting BMI Ending BMI Paired Differences Mean 34.9 31.6 3.3 Standard Deviation 6.9 6.2 1.5 Based on Huelsing, J., Kanafani, N., Mao, J., and White, N. H. "Camp Jump Start: Effects of a residential summer weight-loss camp for older children and adolescents." Pediatrics, Vol. 125, No. 4, Apr. 2010 (Table 3). a. Give the null and alternative hypothesis for determining whether the mean BMI at the end of camp is less than the mean BMI at the start of camp. b. How should the data be analyzed, as an independent- samples 1-test or as a paired-difference 1-test? Explain.

Glencoe Algebra 1, Student Edition, 9780079039897, 0079039898, 2018
18th Edition
ISBN:9780079039897
Author:Carter
Publisher:Carter
Chapter10: Statistics
Section10.3: Measures Of Spread
Problem 1GP

Related questions
Question
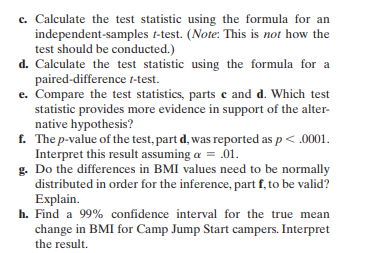
Transcribed Image Text:c. Calculate the test statistic using the formula for an
independent-samples t-test. (Note: This is not how the
test should be conducted.)
d. Calculate the test statistic using the formula for a
paired-difference t-test.
e. Compare the test statistics, parts c and d. Which test
statistic provides more evidence in support of the alter-
native hypothesis?
f.
The p-value of the test, part d, was reported as p < .0001.
Interpret this result assuming a = .01.
g. Do the differences in BMI values need to be normally
distributed in order for the inference, part f, to be valid?
Explain.
h. Find a 99% confidence interval for the true mean
change in BMI for Camp Jump Start campers. Interpret
the result.
Transcribed Image Text:9.40 Summer weight-loss camp. Camp Jump Start is an
8-week summer camp for overweight and obese adoles-
cents. Counselors develop a weight-management pro-
gram for each camper that centers on nutrition education
and physical activity. In a study published in Pediatrics
(Apr. 2010), the body mass index (BMI) was measured
for each of 76 campers both at the start and end of camp.
Summary statistics on BMI measurements are shown in
the table.
Starting BMI
Ending BMI
Paired Differences
Mean
34.9
31.6
3.3
Standard Deviation
6.9
6.2
1.5
Based on Huelsing, J., Kanafani, N., Mao, J., and White, N. H. “Camp
Jump Start: Effects of a residential summer weight-loss camp for older
children and adolescents." Pediatrics, Vol. 125, No. 4, Apr. 2010 (Table 3).
a. Give the null and alternative hypothesis for determining
whether the mean BMI at the end of camp is less than the
mean BMI at the start of camp.
b. How should the data be analyzed, as an independent-
samples t-test or as a paired-difference t-test? Explain.
Expert Solution
This question has been solved!
Explore an expertly crafted, step-by-step solution for a thorough understanding of key concepts.

This is a popular solution!

Trending now
This is a popular solution!

Step by step
Solved in 4 steps

Recommended textbooks for you
Glencoe Algebra 1, Student Edition, 9780079039897…
Algebra
ISBN:
9780079039897
Author:
Carter
Publisher:
McGraw Hill
Glencoe Algebra 1, Student Edition, 9780079039897…
Algebra
ISBN:
9780079039897
Author:
Carter
Publisher:
McGraw Hill