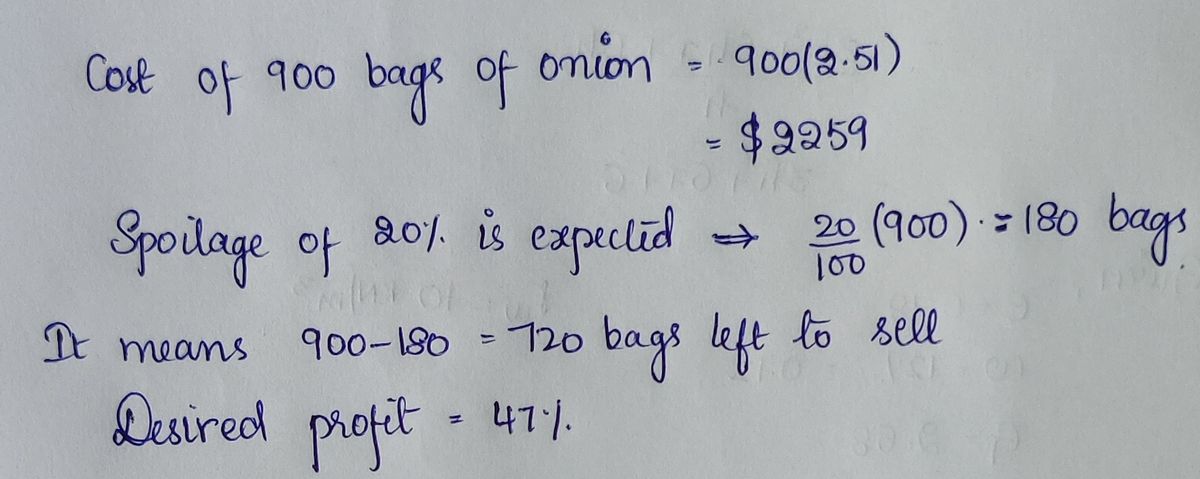
900 bags of onions were purchased at $2.51 per bag the desired markup is 47% based on selling price but 20% spoilage is expected what should the selling price per bag be (in $ per bag ) round to the nearest cent.)


Contingency Table
A contingency table can be defined as the visual representation of the relationship between two or more categorical variables that can be evaluated and registered. It is a categorical version of the scatterplot, which is used to investigate the linear relationship between two variables. A contingency table is indeed a type of frequency distribution table that displays two variables at the same time.
Binomial Distribution
Binomial is an algebraic expression of the sum or the difference of two terms. Before knowing about binomial distribution, we must know about the binomial theorem.
900 bags of onions were purchased at $2.51 per bag the desired markup is 47% based on selling price but 20% spoilage is expected what should the selling price per bag be (in $ per bag ) round to the nearest cent.)

Trending now
This is a popular solution!

Step by step
Solved in 2 steps with 2 images


