A 1 SUMMARY OUTPUT 23 B Regression Statistics 4 Multiple R 5 R Square 6 Adjusted R Square 7 Standard Error 8 Observations 9 10 ANOVA 11 12 Regression 13 Residual 14 Total 15 16 17 Intercept 18 19 20 21 22 23 24 25 C + 0.18393 CORRELATION COEFFICIENT 0.03383 COEFFICIENT OF DETERMINATION 0.022725 40.83543 89 SS df 1 87 88 Coefficients 55.43024 1765 -0.00317 D Standard Error E F 1 MS F ignificance F 5079.773861 5079.774 3.046283 0.084453 145075.2823 1667.532 150155.0562 t Stat P-value Lower 95% Upper 95%ower 95.0%pper 95.0% 7.039246486 7.874456 8.9E-12 41.43897 69.4215 41.43897 69.4215 0.001814051 -1.74536 0.084453 -0.00677 0.000439 -0.00677 0.000439 G H K


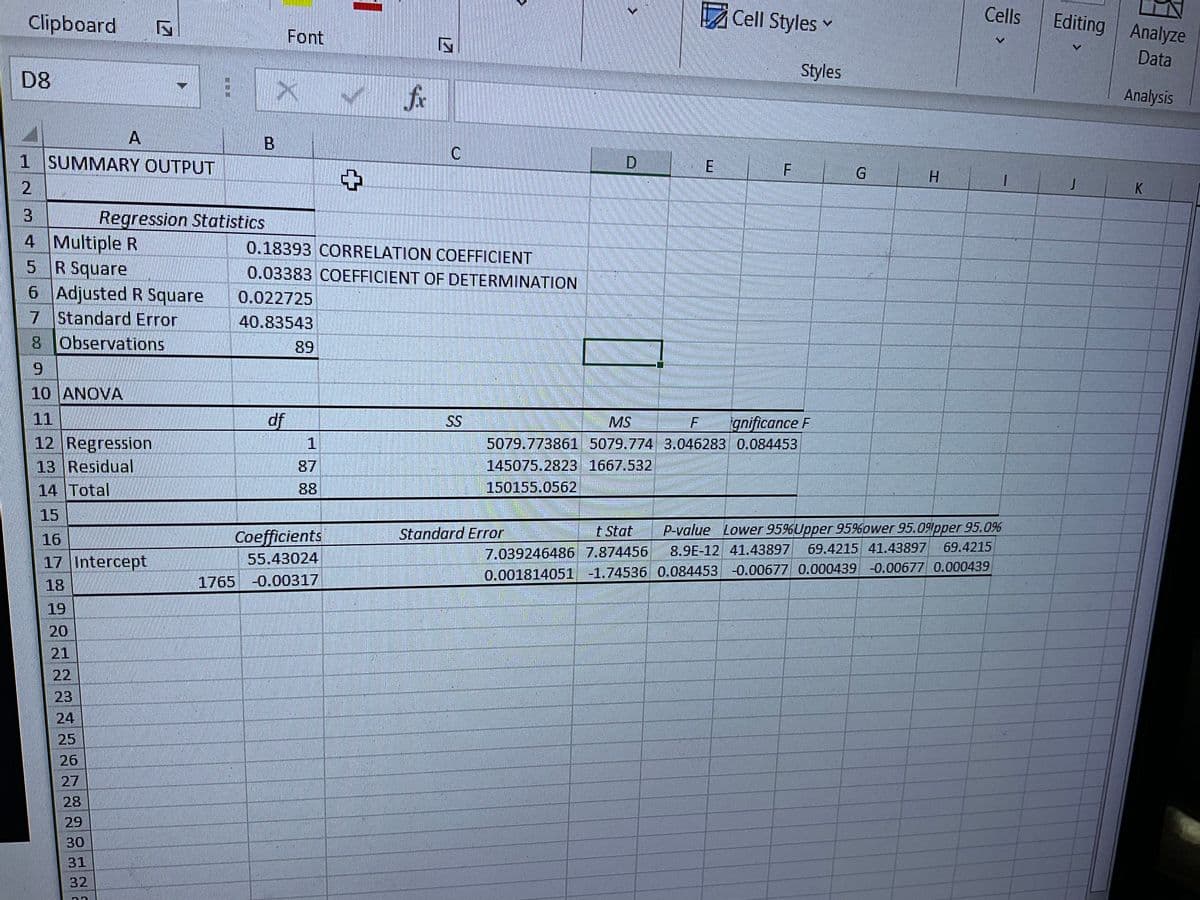
Q: Interpret the Coefficient of Determination New Cases New Deaths 1765 4 1097 5 891 4 959 6 937 58…
A: Coefficient of determination is the square of correlation coefficient. Correlation coefficient is…
Q: Question 11 P(BA)= Be sure to give probability as a decimal to two decimal places.
A: Given : Event A : Student prefers Coke over Pepsi Event B : Student like running The prob. that…
Q: Every employee of Space Electronix took a weight test. The average weight of 240 employees are 70 kg…
A:
Q: Your sample consists of 50 subjects, with a mean of 38 and standard deviation of 1.89. The…
A: Suppose, μ is the population mean.
Q: 5. Find and shade the required area. (a) Find the area under the normal curve from z=1.12 to…
A: Here we have to find and shade the required area a) The area under the normal curve from z= 1.12 to…
Q: Paul's Pretzel company sells bags of pretzels that have a mean weight of 4.2 ounces and a standard…
A: Given,mean(μ)=4.2standard deviation(σ)=0.15
Q: 1. The owner of a coffee shop recorded the number of customers who ca his cafè each hour in a day.…
A: Given data : 5,8,9,9,10,10,11,12,14,17
Q: The critical region and critical value for a hypothesis test are shown below. The test statistic is…
A: Given Z=1.55
Q: Motor vehicles arrive at a toll gate according to a Poisson process with rate λ = 2 vehicles per…
A: Given: Motor vehicles arrive at a toll gate according to a Poisson process with rate λ = 2 vehicles…
Q: HANDWRITTEN.
A:
Q: The security guard of Sinampaloc National High School recorded the number of parents who entered the…
A: Given that Security guard of Sinampaloc National High School recorded the no. of parents entered the…
Q: What is the critical value, t, for a 95% confidence interval with a sample size of 18? 02.101 O…
A: Given that Sample size n =18 95% confidence interval
Q: The coordinates of a random point in the plane obey the normal distribution law f(x, y) = 2m0₂0₂…
A:
Q: The marketing manager of a large multinational corporation is concerned that some salespersons…
A:
Q: There are six consumers of electric current. The probability that under certain conditions a…
A:
Q: Let x be a random variable that represents the percentage of successful free throws a professional…
A: Explanation:Here given the table values and find the sigma x In step2 the final answer clearly…
Q: A toothpaste industry conducted a survey on consumer preference in Laguna. The survey showed that…
A:
Q: Given a J.p.f of x and y as (x + y for 0<x<1,0 <y<1 f(x, y) = {* t " O.W then the marginal.p.f of x…
A:
Q: Thanks to an initiative to recruit top students, an administrator at a college claims that this…
A: From the provided information, Sample size (n) = 11 Sample mean (x̄) = 118 Sample standard deviation…
Q: Which of the following is the correct formula for the margin of error of a population mean where the…
A: Margin of error: A margin of error is a statistical measurement for the diff. between actual and…
Q: A marriage counselor has traditionally seen that the proportion p of all married couples for whom…
A:
Q: In a sample of 100 Republicans, 60 favored the President's anti-drug program. While in a sample of…
A: Given: In a sample of 100 Republicans, 60 favored the president's anti-drug program. While in a…
Q: ments were made before adopting the diet and I month after. Subject 1 2 3 4 Before After Difference*…
A: Mean is given by, x̄= ΣXi/n = 499/24 = 20.79167
Q: toto In physiology, an objective measure of aerobic fitness is how efficiently the body can absorb…
A: First we define hypothesis for the above test. The Variables are weight, maximum-pulse and…
Q: A group of 20 students have been on holiday abroad and are returning to Norway. In the group, there…
A:
Q: Calculate the sample standard deviation of the data shown. Round to two decimal places. X 23 29 11…
A: Given data is x={23,29,11,13,28,22,27,25}sample size(n)=8
Q: Use the Venn diagram to answer the questions E = 40 students 10 10 2 Cats 9 Dogs A student is…
A: Given problem Given that P(Cats)= 28/40 P(Dogs)= 19/40 P(Birds)= 15/40 P(Cats and Dogs and…
Q: A number of years ago, Goku’s power level on n = 100 different days was normally distributed, with a…
A:
Q: Exercise of simulation uses the logical relationships and mathematical expressions of the O…
A: Given problem Given that Exercise of simulation uses the logical relationships and mathematical…
Q: QUESTION 3 A manager wishes to simulate 10 days of operation of an inventory system. The beginning…
A:
Q: 6. Let X₁, X2, ..., X6 be a random sample from a distribution with density function f(x; 0) [0x⁰-1…
A:
Q: The following contingency table summarizes the drug test results for 422 test-takers: Positive…
A: Introduction: We need to first obtain the row totals, column totals, and grand total from the table.
Q: 10. Mr. Sy asserts that fewer than 5% of the bulbs that he sells are defective. Suppose 300 bulbs…
A: Claim: The fraction of defective bulbs is less than 0.05sample size(n)=300
Q: You want to obtain a sample to estimate a population mean. Based on previous evidence, you believe…
A:
Q: 6. Given a normal distribution with a mean of 400 and a standard deviation of 60, find the…
A:
Q: 195 255 245 235 238 210 198 199 245 209 212 185 175 178 175 190
A: Using 2k >n rule (64>40) there are 6 classes x 241 203 201 251 236 190 258…
Q: The probability of an event depends on the random variable X and can be expressed by the following…
A: Given:P(A|x)=1-e-kx ;x≥0 where k>0Given that X is a normally distributed random variable with…
Q: be applied.
A: Two sample hypothesis testing: It is a statistical analysis technique to test if there is a…
Q: The following is a Time Series of Two Years (2019-2020) Seasons Year Sales 4-periods MA Q1 179…
A: The question is about time series analysis Given :
Q: Given 100, 105, 120, 95, 110, 150, 78, 94, 88. Find: 1. Position of Q1 2. Position of D6 3. Q3
A:
Q: Grouped Data 1. The data below shows frequency distributions of fasting serum triglyceride of 100…
A: Given data is Serum Triglyceride Class Frequency(f) 60-76 14 77-93 17 94-110 31 111-127…
Q: Given a marginal p.m.f of x: f₁(x) = and a marginal p.m.f of y: f₂(y) = {2 X & Y are stochastically…
A:
Q: The number of new products containing an artificial sweetener are shown in the table to the right…
A: year Number of new products 1980 407 1981 193 1982 87 1983 46 1984 20 a) The scatter…
Q: Problem 7 - (part 1) What is the sum of the mean, median, and mode of these data? 4, 5, 6, 10, 10…
A: Given problem Given that part 1 : Given data 4, 5, 6, 10, 10 Mean : It is defined as , = Sum of…
Q: Cardiovascular Disease The data in Table 1 are a sample of cholesterol levels taken from 24 hospital…
A: Mean, x̄= ΣXi/n Here sample size is n= 24 Mean x̄= 499/24 = 20.79167 Standard deviation=…
Q: Pete kept records of the fuel efficiency of his car. After the first 100 times he filled up the…
A:
Q: The human resources department of a large investment bank announced that the number of people it…
A:
Q: Differentiate Independent and Dependent Samples and give an example for each method..
A: Independent samples are samples that are selected randomly in order that its observations don't rely…
Q: 4. Use the given histogram to answer the following: Temperatures in Cleveland 6- 51 Frequency 3 N L…
A: Statisticians use histogram to graphically represent continuous data.
Q: A lottery is conducted that involves the random selection of numbers from 0 to 4. To make sure that…
A: The lottery is conducted to randomly select numbers from 0 to 4.
state your conclusion

Step by step
Solved in 2 steps

- The service regresses the number of complaints lodged against an employee last year on the hourly wage of the employee for the year. The analyst ran a simple linear regression shown below. Table 7: Model Summary Model R R Square Adjusted R Square Std. Error of the Estimate 1 .854a .730 .695 6.6235 a. Predictors: (Constant), Hourly Wage Table 8: ANOVA ANOVAb Model Sum of Squares df Mean Square F Sig. 1 Regression 1918.458 1 1918.458 129.783 .000a Residual 709.567 48 14.782 Total 2628.025 49 a. Predictors: (Constant), Hourly Wage b. Dependent Variable: Number of Complaints Table 9: Coefficients Coefficientsa Model Unstandardized Coefficients Standardized Coefficients t Sig. B Std. Error Beta 1 (Constant) 20.2 4.357 4.636 .000 Hourly Wage -1.20 .088 -.946 -13.636 .000 a. Dependent Variable: Number of…The service regresses the number of complaints lodged against an employee last year on the hourly wage of the employee for the year. The analyst ran a simple linear regression shown below. Table 7: Model Summary Model R R Square Adjusted R Square Std. Error of the Estimate 1 .854a .730 .695 6.6235 a. Predictors: (Constant), Hourly Wage Table 8: ANOVA ANOVAb Model Sum of Squares df Mean Square F Sig. 1 Regression 1918.458 1 1918.458 129.783 .000a Residual 709.567 48 14.782 Total 2628.025 49 a. Predictors: (Constant), Hourly Wage b. Dependent Variable: Number of Complaints Table 9: Coefficients Coefficientsa Model Unstandardized Coefficients Standardized Coefficients t Sig. B Std. Error Beta 1 (Constant) 20.2 4.357 4.636 .000 Hourly Wage -1.20 .088 -.946 -13.636 .000 a. Dependent Variable: Number of…A study investigated the link between speed of an automobile at the time of a crash, and the cost of the insurance claim. Below is the residual plot and the output from Excel.SUMMARY OUTPUT Regression Statistics Multiple R 0.17652 R Square 0.03116 Adjusted R Square 0.03116 Standard Error 0.42014 Observations 225 ANOVA df SS MS F Significance F Regression 1 1.266 1.266 7.1717 0.00795 Residual 223 39.363 0.1765 Total 224 40.629 Coefficients Standard Error t-Stat P-value Lower 95% Upper 95% Intercept 0.843 2.2068 0.382 0.703 -3.5066 5.1926 X Variable 1 0.003807 0.001422 2.678 0.00795 0.001 0.0066 Are there any assumptions for regression that you feel ought to be examined? The residuals to do not average zero since the middle is about 50Normality because there are a lot of outliers on the low end Linearity because of the rainbow type curveIndependence because there are more high speed crashes than low speed crashesConstant Variance because some…
- A real estate builder wishes to determine how house size (House) is influenced by family income (Income) and family size (Size). House size is measured in meter square and income is measured in IDR millions. The builder randomly selected 50 families and ran the multiple regression. Partial Microsoft Excel output is provided below: Regression Statistics Multiple R 0.8479 R Square 0.7189 Adjusted R Square 0.7069 Standard Error 17.5571 Observations 50 ANOVA df SS MS F Significance F Regression 370443.3236 18521.662 0.0000 Residual 14487.7627 308.2503 Total 49 51531.0863 Coefficients Standard Error t Stat P-value Intercept -5.5146 7.2273 -0.763 0.4493 Income 0.4262 0.0392 10.8668 0.0000 Size 5.5437 1.6949 3.2708 0.00020 a. What is the population model of this regression problem?b. What is the sample estimates of the regression problem?c. Which of the independent variables in the model are significant at the 5% level?…SUMMARY OUTPUT Regression Statistics Multiple R 0.664798 R Square 0.441957 Adjusted R Square 0.376305 Standard Error 6.412199 Observations 20 ANOVA df SS MS F Significance F Regression 2 553.5729 276.7864 6.731793 0.007025498 Residual 17 698.9771 41.1163 Total 19 1252.55 Coefficients Standard Error t Stat P-value Lower 95% Upper 95% Intercept 26.6651 13.92768 1.91454 0.072535 -2.71974085 56.04995 X1 4.00929 1.1224 3.572068 0.002347 1.641232912 6.377348 X2 0.810165 0.477768 1.69573 0.108172 -0.19783686 1.818168 a. What can you say about the strength of this relationship for the model using the F test? Use α = .05. b. Is y significantly related to each independent variable? Use α = .05. c. Would your answer to b change if α = .001? If so, how? (3+4+3)A researcher’s results are shown below using Femlab (labor force participation rate among females) to try to predict Cancer (death rate per 100,000 population due to cancer) in the 50 U.S. states. Regression Statistics Multiple R 0.313422848 R Square 0.098233882 Adjusted R Square 0.079447088 Standard Error 32.07003698 Observations 50 Variable Coefficients Standard Error t Stat Intercept 343.619889 61.0823514 5.62552 Femlab –2.2833659 0.99855319 –2.28667 Which statement is valid regarding the relationship between Femlab and Cancer? Multiple Choice At the .05 level of significance, there isn’t enough evidence to say the two variables are related. This model explains about 10 percent of the variation in state cancer rates. If your sister starts working, the cancer rate in your state will decline. A rise in female labor participation rate will cause the cancer rate to decrease within a state.
- A regression analysis was performed and the summary output is shown below. Regression Statistics Multiple R 0.7802268560.780226856 R Square 0.6087539470.608753947 Adjusted R Square 0.5870180550.587018055 Standard Error 6.7217061336.721706133 Observations 2020 ANOVA dfdf SSSS MSMS F� Significance F� Regression 11 1265.3871265.387 1265.3871265.387 28.006928.0069 4.9549E-054.9549E-05 Residual 1818 813.264813.264 45.18145.181 Total 1919 2078.6512078.651 Step 1 of 2: How many independent variables are included in the regression modelA business is evaluating their advertising budget, and wishes to determine the relationship between advertising dollars spent and changes in revenue. Below is the output from their regression. SUMMARY OUTPUT Regression Statistics Multiple R 0.95 R Square 0.90 Adjusted R Square 0.82 Standard Error 0.82 Observations 8 ANOVA df SS MS F Significance F Regression 3 23.188 7.729 11.505 0.020 Residual 4 2.687 0.672 Total 7 25.875 Coefficients Std Error t Stat P-value Lower 95% Upper 95% Intercept 83.91 2.03 41.36 0.00 78.28 89.54 TV ($k) 1.96 0.48 4.10 0.01…A business is evaluating their advertising budget, and wishes to determine the relationship between advertising dollars spent and changes in revenue. Below is the output from their regression. SUMMARY OUTPUT Regression Statistics Multiple R 0.95 R Square 0.90 Adjusted R Square 0.82 Standard Error 0.82 Observations 8 ANOVA df SS MS F Significance F Regression 3 23.188 7.729 11.505 0.020 Residual 4 2.687 0.672 Total 7 25.875 Coefficients Std Error t Stat P-value Lower 95% Upper 95% Intercept 83.91 2.03 41.36 0.00 78.28 89.54 TV ($k) 1.96 0.48 4.10 0.01…
- A business is evaluating their advertising budget, and wishes to determine the relationship between advertising dollars spent and changes in revenue. Below is the output from their regression. SUMMARY OUTPUT Regression Statistics Multiple R 0.95 R Square 0.90 Adjusted R Square 0.82 Standard Error 0.82 Observations 8 ANOVA df SS MS F Significance F Regression 3 23.188 7.729 11.505 0.020 Residual 4 2.687 0.672 Total 7 25.875 Coefficients Std Error t Stat P-value Lower 95% Upper 95% Intercept 83.91 2.03 41.36 0.00 78.28 89.54 TV ($k) 1.96 0.48 4.10 0.01…A linear regression was performed on a bivariate data set with variables x and y. Analysis by a computer software package included the following outputs: Sample Size: n=15 Regression Equation: y hate =0.359 - 1.264x Coefficient of Determination: r square = 0.915 Sums of Squares :SSy = 35.617. SSex = 32.589, SSresid = 3.028 a. Calculate the standard error Se. b. write a sentence interpreting the value of rsquare. c.What is the value of Pearson's correlation coefficient? d. Determine whether the variables x and y are significant using a 5% significance level. You may assume a simple random sample from a bivariate normal populaton.A regression analysis was performed and the summary output is shown below. Regression Statistics Multiple R 0.7802268560.780226856 R Square 0.6087539470.608753947 Adjusted R Square 0.5870180550.587018055 Standard Error 6.7217061336.721706133 Observations 20 ANOVA dfdf SSSS MSMS F� Significance F� Regression 11 1265.3871265.387 1265.3871265.387 28.006928.0069 4.9549E-054.9549E-05 Residual 1818 813.264813.264 45.18145.181 Total 1919 2078.6512078.651 Step 2 of 2: Which measure is appropriate for determining the proportion of variation in the dependent variable explained by the set of independent variable(s) in this model?