a) A medical researcher is interested in exploring the effects of a new medicine on blood pressure 500 males with high blood pressure are randomly selected and given the new drug. After two weeks, their blood pressure is measured and the average arterial pressure is calculated. b) A study is conducted to determine whether or not the dangerous activity of texting while drivin is a common practice. 1500 16- to 24-year-olds are randomly selected and asked whether or no they text while driving. Of the 1500 drivers, 12% indicate they text while driving.
a) A medical researcher is interested in exploring the effects of a new medicine on blood pressure 500 males with high blood pressure are randomly selected and given the new drug. After two weeks, their blood pressure is measured and the average arterial pressure is calculated. b) A study is conducted to determine whether or not the dangerous activity of texting while drivin is a common practice. 1500 16- to 24-year-olds are randomly selected and asked whether or no they text while driving. Of the 1500 drivers, 12% indicate they text while driving.

Functions and Change: A Modeling Approach to College Algebra (MindTap Course List)
6th Edition
ISBN:9781337111348
Author:Bruce Crauder, Benny Evans, Alan Noell
Publisher:Bruce Crauder, Benny Evans, Alan Noell
Chapter5: A Survey Of Other Common Functions
Section5.3: Modeling Data With Power Functions
Problem 6E: Urban Travel Times Population of cities and driving times are related, as shown in the accompanying...

Related questions
Question
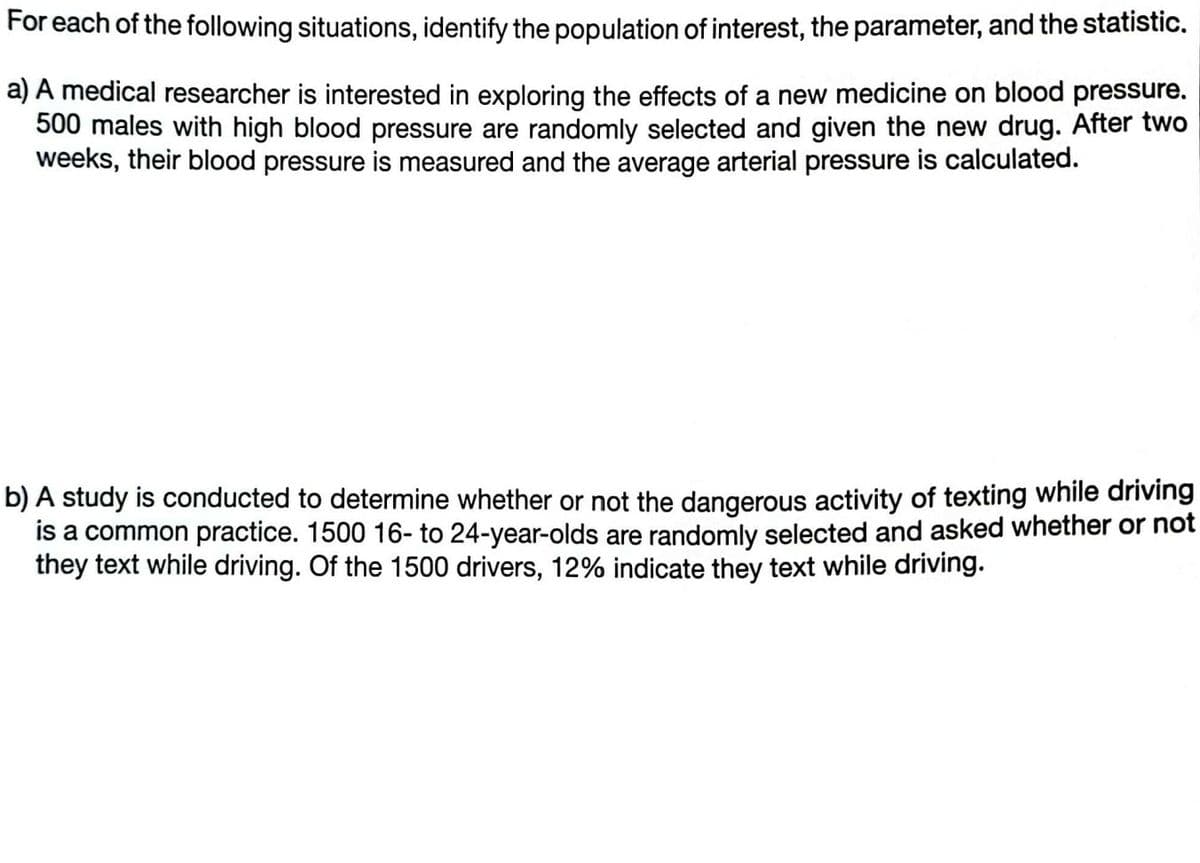
Transcribed Image Text:For each of the following situations, identify the population of interest, the parameter, and the statistic.
a) A medical researcher is interested in exploring the effects of a new medicine on blood pressure.
500 males with high blood pressure are randomly selected and given the new drug. After two
weeks, their blood pressure is measured and the average arterial pressure is calculated.
b) A study is conducted to determine whether or not the dangerous activity of texting while driving
is a common practice. 1500 16- to 24-year-olds are randomly selected and asked whether or not
they text while driving. Of the 1500 drivers, 12% indicate they text while driving.
Expert Solution
This question has been solved!
Explore an expertly crafted, step-by-step solution for a thorough understanding of key concepts.

This is a popular solution!

Trending now
This is a popular solution!

Step by step
Solved in 2 steps

Recommended textbooks for you
Functions and Change: A Modeling Approach to Coll…
Algebra
ISBN:
9781337111348
Author:
Bruce Crauder, Benny Evans, Alan Noell
Publisher:
Cengage Learning
Functions and Change: A Modeling Approach to Coll…
Algebra
ISBN:
9781337111348
Author:
Bruce Crauder, Benny Evans, Alan Noell
Publisher:
Cengage Learning