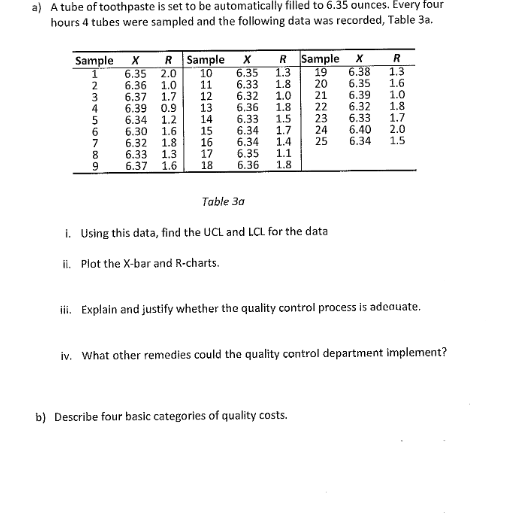
a) A tube of toothpaste is set to be automatically filled to 6.35 ounces. Every four hours 4 tubes were sampled and the following data was recorded, Table 3a. Sample X 1 2 HNMAS6799 3 4 5 6 8 R Sample X R Sample X 6.35 2.0 10 6.36 1.0 11 6.37 1.7 12 6.39 0.9 13 6.34 1.2 14 6.30 1.6 15 6.32 1.8 16 6.33 1.3 17 6.37 1.6 6.35 1.3 19 6.38 6.33 1.8 20 6.32 1.0 21 6.36 1.8 6.33 1.5 6.34 1.7 6.34 1.4 6.35 1.1 18 6.36 1.8 222222 23 24 b) Describe four basic categories of quality costs. R 1.3 6.35 1.6 6.39 1.0 6.32 1.8 25 Table 3a i. Using this data, find the UCL and LCL for the data ii. Plot the X-bar and R-charts. 6.33 1.7 6.40 2.0 6.34 1.5 iii. Explain and justify whether the quality control process is adequate. iv. What other remedies could the quality control department implement?
a) A tube of toothpaste is set to be automatically filled to 6.35 ounces. Every four hours 4 tubes were sampled and the following data was recorded, Table 3a. Sample X 1 2 HNMAS6799 3 4 5 6 8 R Sample X R Sample X 6.35 2.0 10 6.36 1.0 11 6.37 1.7 12 6.39 0.9 13 6.34 1.2 14 6.30 1.6 15 6.32 1.8 16 6.33 1.3 17 6.37 1.6 6.35 1.3 19 6.38 6.33 1.8 20 6.32 1.0 21 6.36 1.8 6.33 1.5 6.34 1.7 6.34 1.4 6.35 1.1 18 6.36 1.8 222222 23 24 b) Describe four basic categories of quality costs. R 1.3 6.35 1.6 6.39 1.0 6.32 1.8 25 Table 3a i. Using this data, find the UCL and LCL for the data ii. Plot the X-bar and R-charts. 6.33 1.7 6.40 2.0 6.34 1.5 iii. Explain and justify whether the quality control process is adequate. iv. What other remedies could the quality control department implement?

College Algebra (MindTap Course List)
12th Edition
ISBN:9781305652231
Author:R. David Gustafson, Jeff Hughes
Publisher:R. David Gustafson, Jeff Hughes
Chapter8: Sequences, Series, And Probability
Section8.7: Probability
Problem 5E: List the sample space of each experiment. Rolling one die and tossing one coin

Related questions
Question
Transcribed Image Text:a) A tube of toothpaste is set to be automatically filled to 6.35 ounces. Every four
hours 4 tubes were sampled and the following data was recorded, Table 3a.
Sample
HOMES6789
2
3
4
5
X R
6.35 2.0
6.36 1.0
6.37
1.7
6.39
0.9
6.34 1.2
6.30 1.6
6.32 1.8
6.33 1.3
6.37 1.6
Sample X R Sample
6.35 1.3 19
10
11
6.33
6.32
6.36
PP
12
13
FP
∞69S7WNTOR
14
15
16
17
18
bobo wi
Table 3a
1.8
1.0
1.8
6.33 1.5 23
6.34 1.7 24
6.34 1.4
25
6.35 1.1
6.36
1.8
CHELE
X
R
6.38
1.3
20 6.35 1.6
6.39 1.0
21
22 6.32 1.8
6.33
6.40
6.34
i. Using this data, find the UCL and LCL for the data
ii. Plot the X-bar and R-charts.
HANNE
b) Describe four basic categories of quality costs.
1.7
2.0
1.5
iii. Explain and justify whether the quality control process is adequate.
iv. What other remedies could the quality control department implement?
Expert Solution
This question has been solved!
Explore an expertly crafted, step-by-step solution for a thorough understanding of key concepts.

This is a popular solution!

Trending now
This is a popular solution!

Step by step
Solved in 4 steps with 5 images

Recommended textbooks for you
College Algebra (MindTap Course List)
Algebra
ISBN:
9781305652231
Author:
R. David Gustafson, Jeff Hughes
Publisher:
Cengage Learning
College Algebra (MindTap Course List)
Algebra
ISBN:
9781305652231
Author:
R. David Gustafson, Jeff Hughes
Publisher:
Cengage Learning