a) Are the data normal? Run Descriptive statistics in Excel and support your answer. b) Show the results of the correlation in Excel and explain what the results MAY mean. c) Is there absolutely a relationship between this data? Why, why not? d) Plot the data on a scatter chart? Does the chart suggest a relationship of the data? e) Might an outlier have an effect on this data? f) If there were an outlier, which data point might be the outlier? If you were to remove the outlier how would the correlation and the scatter chart be different?
a) Are the data normal? Run Descriptive statistics in Excel and support your answer. b) Show the results of the correlation in Excel and explain what the results MAY mean. c) Is there absolutely a relationship between this data? Why, why not? d) Plot the data on a scatter chart? Does the chart suggest a relationship of the data? e) Might an outlier have an effect on this data? f) If there were an outlier, which data point might be the outlier? If you were to remove the outlier how would the correlation and the scatter chart be different?

Glencoe Algebra 1, Student Edition, 9780079039897, 0079039898, 2018
18th Edition
ISBN:9780079039897
Author:Carter
Publisher:Carter
Chapter4: Equations Of Linear Functions
Section4.5: Correlation And Causation
Problem 27PFA

Related questions
Question
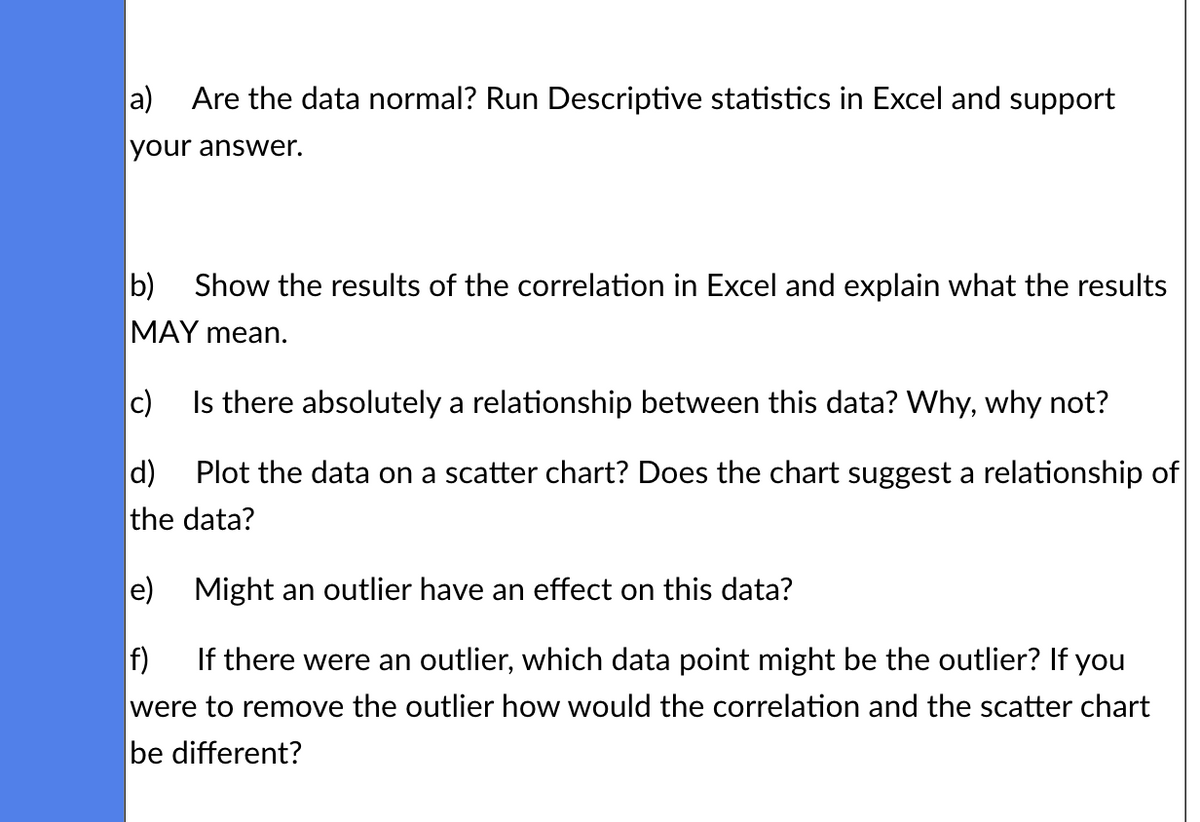
Transcribed Image Text:a) Are the data normal? Run Descriptive statistics in Excel and support
your answer.
b) Show the results of the correlation in Excel and explain what the results
MAY mean.
c) Is there absolutely a relationship between this data? Why, why not?
d) Plot the data on a scatter chart? Does the chart suggest a relationship of
the data?
e) Might an outlier have an effect on this data?
f)
If there were an outlier, which data point might be the outlier? If you
were to remove the outlier how would the correlation and the scatter chart
be different?
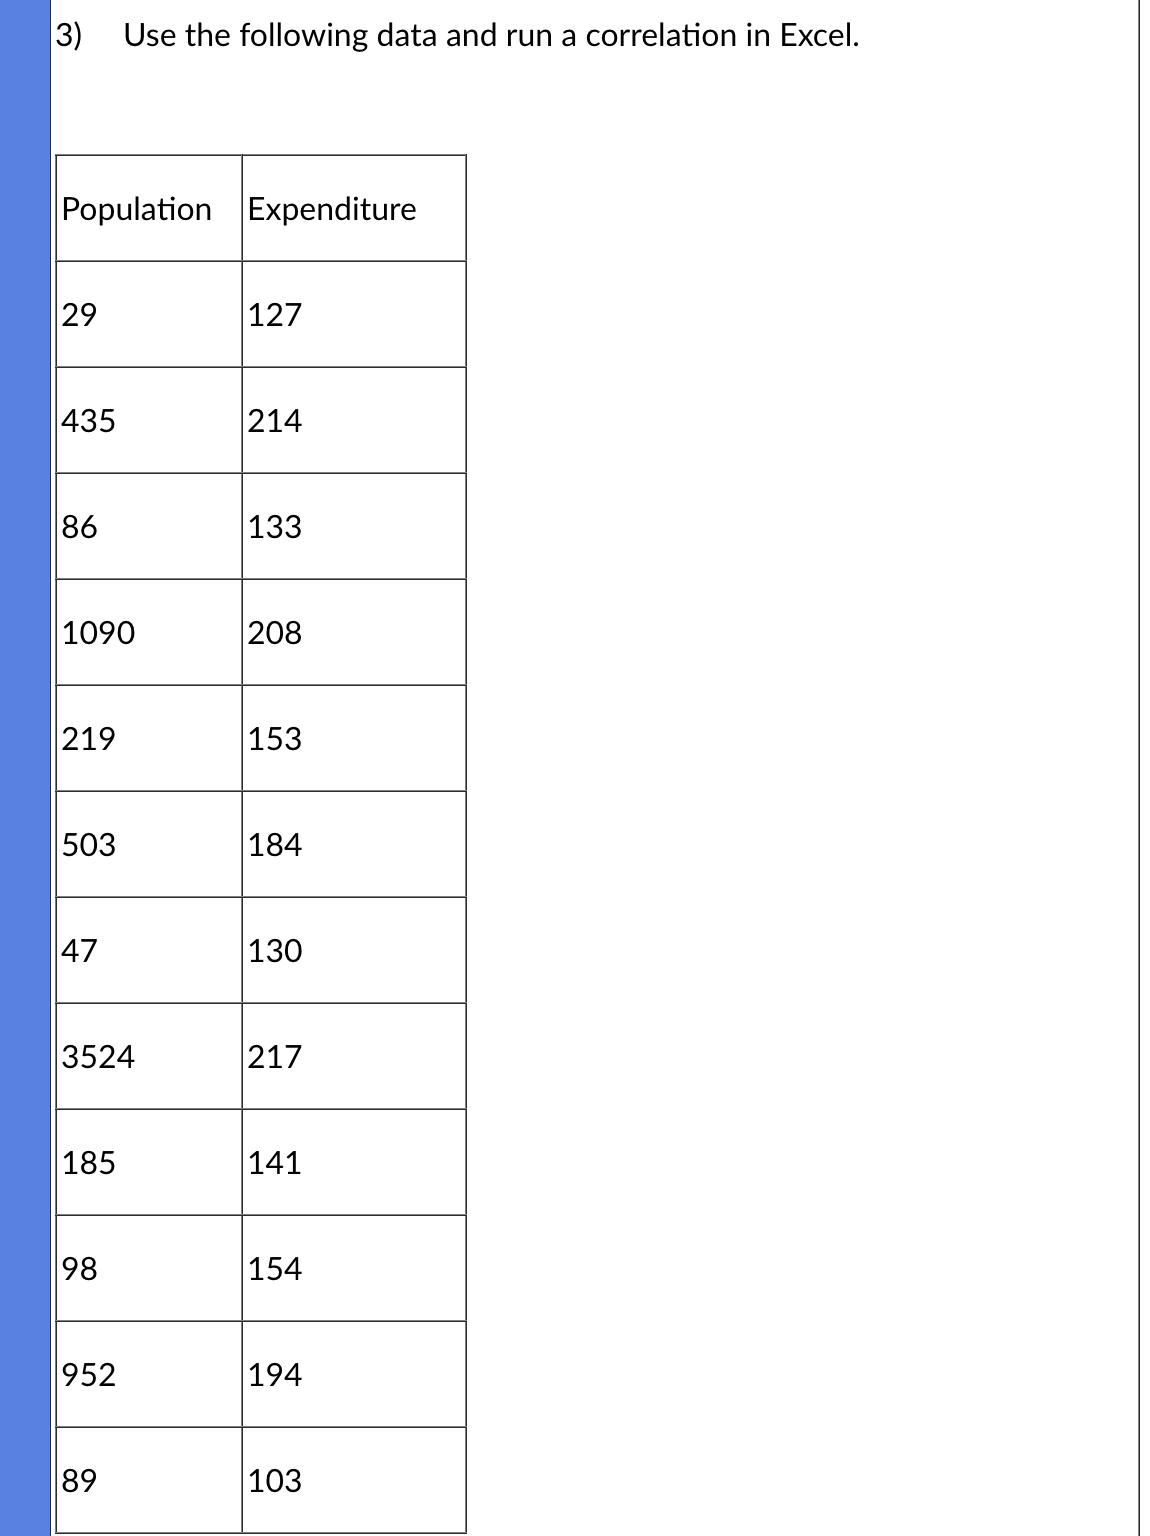
Transcribed Image Text:3)
Use the following data and run a correlation in Excel.
Population Expenditure
29
435
86
1090
219
503
47
3524
185
98
952
89
127
214
133
208
153
184
130
217
141
154
194
103
Expert Solution
This question has been solved!
Explore an expertly crafted, step-by-step solution for a thorough understanding of key concepts.

Step by step
Solved in 8 steps with 4 images

Recommended textbooks for you
Glencoe Algebra 1, Student Edition, 9780079039897…
Algebra
ISBN:
9780079039897
Author:
Carter
Publisher:
McGraw Hill
Glencoe Algebra 1, Student Edition, 9780079039897…
Algebra
ISBN:
9780079039897
Author:
Carter
Publisher:
McGraw Hill