a) b) c) d) Exactly 90 people say they use the Internet. At least 90 people say they use the Internet. That fewer than 90 people say they use the Internet. Are any of the probabilities in parts (a) and (c) unusua
Q: In a random sample of 500 farmers in Fisherville in 2019, 312 said they used cow dung as part of…
A: given data sample size (n) = 500favorable outcomes (x) = 31292% ci p.
Q: A study found that the mean amount of time cars spent in drive-throughs of a certain fast-food…
A: Mean(µ) = 138.7Standard deviations (σ) = 31X ~ N (µ, σ )= N(138.7 31)
Q: A high school senior uses the Internet to get information on February temperatures in the town…
A: Given The data is as follows: The conversion formula is as follows: °F=95°C+32 Max…
Q: The z-scores of the test results of a sample of 43 students follow the T-distribution with 42…
A: The t-distribution is very useful probability distribution when the sample size is small and the…
Q: Question: Why is the value that you calculated for the mean different from the mode and median?
A: Mean , median and mode are different for the skewed data values
Q: For an SRS {Y: 3;=, from the normal distribution. 7/2/2 (Y-M) ² fy (yiu, 0²) - e √22√62 Show that…
A: Solution: Given that {Yi} , where i=1,2,...,n are random variables from Normal distribution having…
Q: 5. A group of sexually active, single male college students was questioned about whether they always…
A: Given information level of significance ɑ=0.05
Q: the Control limits for the chart. n = 4 Q Calculate C=16 n=
A: We have given information, The average number of process nonconformities C=16. The number of samples…
Q: I am wondering what statistical analysis would be best practice to use if I am comparing data from…
A: ANSWER: Comparing data from state to state can involve analysis of multiple variables and can be…
Q: D iew an example F2 N Identify the sample space of the probability experiment and determine the…
A: From the given information we have to determine the number of outcomes in the sample space. Randomly…
Q: You're a data analyst for an insurance company. You want to make sure that your employer is not…
A: Define the Hypothesis for testing Null hypothesis : H0: prices are equal between the two shops…
Q: So the answer is what
A: Here we have given the information about the number of salmon caught in Gaspe. Based on information,…
Q: Evaluate the following formula for x₁ = 97.66, X₂=97.46, H₁-H₂ = 0,0₁=0.84, 0₂ = 0.71, n₁ = 14, and…
A: here data are given we have to answer the test statistics value of z is =?
Q: Interpret the slope for PROP_CHANGE_INCOME if appropriate. If not, argue why. Estimated model =…
A: This question seeks to interpret the slope of the estimated model which relates the proportion of…
Q: (iii) Explain the difference in meaning between P (Dizziness Placebo) and P (Placebo Dizziness).
A: Given that The difference in meaning between P(Dizziness|Placebo) and P(Placebo|Dizziness).…
Q: a. Find P(E3) if P(E₁) = 0.1, P(E₂) = 0.2, P(E4) = 0.3, and P(E5) = 0.2. P(E3)= (Type an exact…
A: Given that : P(E1)=0.1 P(E2)=0.2 P(E3)=0.3 P(E5)=0.2 We have to find ,P(E3)=?
Q: IQ Scores How many students have a score of at least 94? What is the class size of the given table?…
A: Introduction The frequency denotes the no. of times an observation has occurred.
Q: We want to obtain a sample to estimate a population mean. Based on previous evidence, researchers…
A: given data σ = 50.798% ci for μ.E = 5n = ?
Q: (Round calculated results to the hundredth (2 place to the right of beyond that unless otherwise…
A: The given data is as follows, Accept rate Grad rate 5 96 5 97 6 95 8 98 10 96 10 94…
Q: 6. A psychologist looked into the perceived quality of life of three groups of 600 older adults aged…
A: The question is about categorical data analysis Given : To find : To test if there is signif.…
Q: The distribution of sample means tends to be a normal distribution. true or false?
A: This question explores the characteristics of the distribution of sample means. Specifically, it…
Q: You are certain to get 3 jacks when selecting 51 cards from a shuffled deck. Express the indicated…
A: According to the question, we have following information : On picking 51cards from a well shuffled…
Q: Can we recheck C. interval was incorrect
A: Answer for part C. Given data : Provide a 95% CI (in ppm) for the difference in mean CO between…
Q: You are supervising a summer student who has come to you with the following plan 2^4 and estimated…
A: Given: A B C D Outputs -1 -1 -1 -1 1.03 1 -1 -1 -1 5.35 -1 1 -1 -1 1.6 1 1 -1 -1 11.73…
Q: ΑΤΑ statistics thinks that the for of the conferences and the timing of the assignments may affect…
A: Here, we have to perform ANOVA test and then conclude results from the test.
Q: A student measuring how gasoline prices change records the cost of gas at 10 randomly selected…
A: Introduction Data are the nos. that are collected and analyzed to draw meaningful insight from it.
Q: The that they all involved intoxicated drivers. data in the following table summarize results from…
A: Given that Total accident=98 Driver intoxicated yes=50
Q: D Question 6 From a sample of 100 observations, you compute the average time to graduate from SDSU…
A: Given information n=100, sample variance=s2=20 , population mean μ=4 Sample mean x̄=4.8
Q: The ages of the 5,000 primary school students surveyed was summarized and displayed in the…
A: Box-and whisker with their 5 summary value is denoted in the following figure
Q: 4. Using the above data on Exercise No. 3, determine if there is significant difference in the…
A: Given data: Bicycle Treadmill Weights 33 42 24 38 35 30 31 40 26 44 46 34 41 37 36…
Q: The distribution of sample variances tends to be a distribution skewed to the right. true or false?
A: When sampling from a normal distribution, by the definition of the Chi-square variate,…
Q: Older people often have a hard time finding work. AARP reported on the number of weeks it takes a…
A: The given sample observations are:
Q: (a) Compute E(XY). (b) Compute E(X).
A:
Q: both answers are incorrect
A: Given data : If a coin is unfair with 'Heads' 5 times more likely than 'Tails find the probability…
Q: Problem #2: Suppose it is known that p = 25% of a certain kind of scratch tickets are winners. In a…
A: We have given that, Population proportion (p) = 25% = 0.25 , favourable cases (x) = 35 and sample…
Q: The SAT has gone through many revisions over the years. People argue that female students generally…
A: This question looks at the differences in SAT scores between male and female students. We will use…
Q: Problem #4(a): Problem #4(b): Problem #4(c): suppose that the true population stan (a) Find a 99%…
A: Given that Sample size n =22 Sample mean=64.3 Population standard deviation =11
Q: Transcription factors are genes that code for proteins that regulate the transcription of multiple…
A: Given information: Studies show how transcription factor Zscan1O controls aspects of development in…
Q: Calculate the standard deviation and variance of the data shown, to two decimal places X 1.5 19.8…
A: The dataset is given as: x 1.5 19.8 3.8 5.7 2.3 14.8 7.5 4.6
Q: please solution about C D and E
A: From (b) F(X)=1-x-9x>10x≤1
Q: A sample of 314 patients between the ages of 38 and &82 were given a combination of the drugs…
A: Given The data is as follows: Sample size, n=314 Sample mean, x¯=0.94 Population standard deviation,…
Q: Suppose you just received a shipment of eleven televisions. Two of the televisions are defective. If…
A: Given that 11 televisions , 2 of the televisions are defective If two televisions are randomly…
Q: The following gives the national percentages of adults in a given age group. Use Google Sheets or…
A: Given data , Age Group Percentage 18-29 17 30-44 27 45-59 25 60 or older 31
Q: The following shows the age of 20 children Age frequency 1 5 2 6 3 7 4 2
A: We have given that, Age (X) frequency (f) 1 5 2 6 3 7 4 2 Then,…
Q: A researcher has collected the following sample data. The mean of the sample is 5. 3 5 12 3 2 The…
A: Arrange the given data in ascending order2,3,3,5,12sample size(n)=5
Q: There are two traffic lights on a commuter's route to and from work. Let X₁ be the number of lights…
A: T0 = X1 + X2 Sample size (n=2) So value of (X1,X2) (X1,X2) =…
Q: Question: What measure of central tendency do you think would be best to describe the number of…
A: The best measure of central tendency to describe the number of points scored per game for the whole…
Q: 7. The following table shows the returns of an energy sector ETF. What is the Mean Absolute…
A: We have given information about the return of energy sector as follows, Year Energy Sector ETF…
Q: Use the dataset "HT_3341.xls" and conduct a two-sample t-test using Excel. You'd like to test the…
A: We have given the data set of two samples (column A and column B) as follows, X1 X2 99.77 97.13…
Q: The demand for a product varies from month to month. Based on data from past years, the following…
A: Probabilities of MNM company's monthly demand Unit Demand P(X=x) 1200 0.19 2100 0.30 3300…
Please answer C and D using EXCEL:
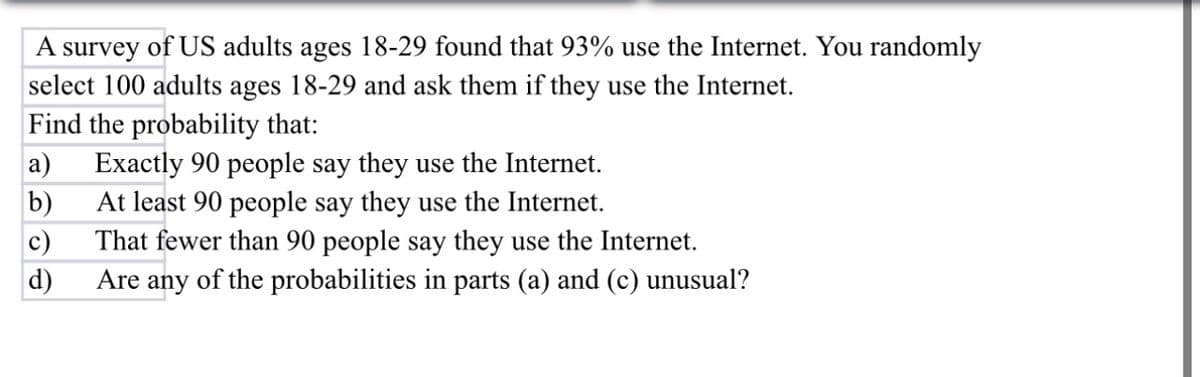
Given the information
n= 100
p=93%
p= 0.93
Let X be the number of people use the Internet
X follows the Binomial Distribution with parameter n=100 & p = 0.93
We can find the probability by using the Binomial distribution in Excel.
a) We have to find the probability that exactly 90 people say use the Internet.
we can write it in symbol as
we can use the command
Trending now
This is a popular solution!
Step by step
Solved in 3 steps