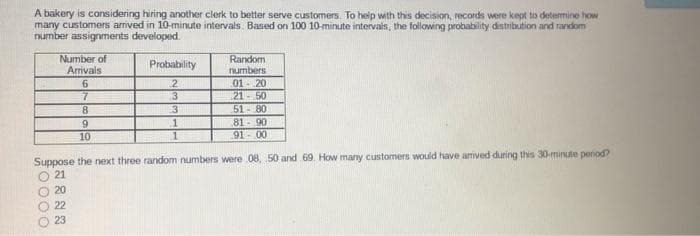
A bakery is considering hiring another clerk to better serve customers. To help with this decision, records were kept to determine how many customers arnved in 10-minute intervals. Based on 100 10-minute intervais, the following probability distribution and random number assignments developed. Number of Arrivals Random numbers Probability .01- 20 21-50 51-80 81 - 90 91- 00 .3 8. 9. 10 Suppose the next three random numbers were 08, 50 and 69. How many customers would have arived during this 30-minute penod? 21 20 22 23 0000


Q: d. What is the probability that three or more people are at the coffee urn? (Do not round…
A: THE ANSWER IS AS BELOW:
Q: Willow Brook National Bank operates a drive-up teller window that allows customers to complete bank…
A: Note: - As we can answer only up to three subparts we will answer the first three subparts (a, b,…
Q: What is the probability that the project can be completed within 16 weeks?
A: ANSWER IS AS BELOW:
Q: expense of installing air pollution control equipment. The local environmental protection group has…
A:
Q: From past experience, Anna knows that the probability that her friend will take her to dinner in…
A: the probability that her friend will take her to dinner in Orro Resto = 0.7 the probability that…
Q: obs arrive at Loaf Machine Shop. Assume the arrival rate is five jobs per hour. Service times (in…
A: Given:For design A:Mean service time= 6S.d=3For design B:Mean service time= 6.25S.d=0.6
Q: Universal bus service operates seven days in a week. A trip from Delhi to Rajpura takes six hours by…
A: To determine optimal assignments, first, we calculate layover times from the above time…
Q: The emergency room of the Time Between Arrivals (min.) community hospital in Farmburg has one…
A: The probability distribution provides the likelihood of occurrence of different values taken by some…
Q: The time between arrivals of buses follows anexponential distribution, with a mean of 60 minutes.a…
A: Hence, the probability that exactly four buses will arrive during the next 2 hours is 0.0902.
Q: (a) An art dealer's client is willing to buy the Sunflower painting at $50,000. The dealer can buy…
A: The question demands to make a decision tree and determine the strategy that will maximize the…
Q: Difference between the actual value and the value that was predicted for a given period.
A: The difference between the actual value of a period and the predicted value of the same period is…
Q: The Hoylake Rescue Squad receives an emergency call every 1, 2, 3, 4, 5, or 6 hours, accordingto the…
A: The Hoylake Rescue Squad receives an emergency call every 1, 2, 3, 4, 5, or 6 hours, according to…
Q: Willow Brook National Bank operates a drive-up teller window that allows customers to complete bank…
A: The waiting model in queuing theory helps to calculate the time of serving each customer and its…
Q: usinessman must decide whether to open a new mini grocery branch or simply extend the number of…
A: Given; payoff : P150,000 probabilities : 35%-65% advertising cost : P45,000
Q: A factory has a frequency of breakdown of their machine per month as shown in table below and the…
A: Given- Frequency of breakdown of the machine/month Number of breakdowns Frequency 0 20 1 30…
Q: The time between arrivals of cars at the Petroco Service Station is defined by the following…
A:
Q: Consider the M/M/1 queueing system with arrival rate λ > 0 and service rate μ > 0. (a) Compute the…
A: This question must be solved using the superposition of two Poisson processes. As per superposition…
Q: Universal bus service operates seven days in a week. A trip from Delhi to Rajpura takes six hours by…
A: To determine optimal assignments, first, we calculate layover times from the above time table.…
Q: According to the XYZ Apartment Rental Company ER diagram, which of the following is true? A) It is…
A: ANSWER : Option : A) It is not possible to keep track of builders that did not build any of the…
Q: Consider a coffee shop where customers arrive on average every 3.5 minutes. There are three…
A: The answer is none of the choices.
Q: A certain city the Transportation Authority (CTA) has trollies leaving regularly throughout the day…
A: THE ANSWER IS AS BELOW:
Q: Automobile repair cost continue to rise with the average cost now at $367 per repair. Assume that…
A: Normal distribution with SD = $88 and mean = $367. The z-value at $480 = (480-367)/88 = 0.9004 (left…
Q: Schware Foundry, Inc., a metal works plant in Tucker Valley Park, Macoya, has long been trying to…
A:
Q: An electric cintractors record during the last five weeks indicate the number of job requests…
A: Given data
Q: (1 point) Suppose that X is normally distributed with mean 90 and standard deviation 14. A. What is…
A: The concept used here is Normal distribution and using the standard normal table.
Q: Willow Brook National Bank operates a drive-up teller window that allows customers to complete bank…
A: Given λ=0.4 and μ=0.6
Q: 41. A manager is góing to purchase new processing equipment and must decide on the number of spare…
A: Ratio method – Number Probability Cumulative probability 0 0.10 0.10 1 0.50…
Q: John Hospital contains 450 beds. The average occupancy rate is 80% per month. In other words, on…
A: High low method is a way to separate the fixed and variable costs with a limited amount of the data.…
Q: Harold Grey owns a small farm in the Salinas Valley that grows apricots. The apricots are dried on…
A: a) Maximum demand in any year is 300,000 in year 1. Beginning inventory is 20,000. So net…
Q: Ms. Amina is a legal secretary who has worked at an organization with powerful male boss for twenty…
A: Note: Since you have posted multiple questions. We will answer the first one. Please send the other…
Q: What is its ssmpling procedures and its justification.
A: The sampling method used by Alex is Random sampling. Random sampling is a sampling strategy in which…
Q: What does the intercept mean in equation below ? X: C18 (total employees hours worked per week)…
A: Given Information: X = Total employee hours worked per week Y = Number of clinic patients seen per…
Q: The arrival rate of patients at a hospital counter follows Poisson distribution with a mean of 25…
A: Probability of having 0 patients in the system indicating that the number of customers as 0 and the…
Q: Jobs arrive at Loaf Machine Shop. Assume the arrival rate is five jobs per hour. Service times (in…
A: Given: For design A:mean service time = 6S.D = 3For design Bmean service time = 6.25S.D = 0.6
Q: The frequency of breakdown of a machine that issues lottery tickets is given in the following…
A: Any production system using machines will have its share of breakdowns. Every breakdown means a cost…
Q: A single server queuing system with a Poisson arrival rate and exponential service time has an…
A: Service rate is the rate at which the arrived customers are served in the system.
Q: An airline company has drawn up a new flight schedule involving five flights. To assist in…
A: The number of rows = 5 and columns = 5 A B C D E A 8 2 M 5 4 B 10 9 2 8 4…
Q: Analyze this data using an appropriate control chart
A: P-chart is a type of control chart which using nonconforming samples and its proportions. It is the…
Q: Howard Weiss, Inc., is considering building a sensitive new radiation scanning device. His managers…
A: Probability = 0.40 Expected profit without suit = $40000 Expected profit with suit =$ 20000…
Q: T1.2 What are the expected value and variance of the following probability distribution? VARIABLE, X…
A: Find the given details below: Given Details: Variable X Probability 1 0.05 2 0.05 3 0.1…
Q: A company installs new central-heating furnaces and has found that for 15% of all installations, a…
A: a. The probability of requiring a return visit in all these cases can be computed as follows: Given,…
Q: Consider a cheap talk game in which Nature chooses the sender’s type andthere are three feasible…
A: The following beliefs can be considered for the receiver: With message m1, the assigned probability…
Q: From Operations and Supply Chain Management 10th edition by ROBERTA S. RUSSELL BERNARD W. TAYLOR…
A: A Small Introduction about Supply Chain Management Supply chain management (SCM) is the discipline…
Q: c. The time in minutes, until a customer approaches a cashier in a grocery, has an exponential…
A: In Probability insights, the exponential distribution is a nonstop likelihood distribution that…
Q: McHardee Press publishes the Fast Food Menu Book and wishes to determine how many copies to print.…
A: m = 12,000. To find σ note that z = 2.31 corresponds to a 7% tail probability. Therefore, (20,000…
Q²


Trending now
This is a popular solution!

Step by step
Solved in 2 steps

- W. L. Brown, a direct marketer of womens clothing, must determine how many telephone operators to schedule during each part of the day. W. L. Brown estimates that the number of phone calls received each hour of a typical eight-hour shift can be described by the probability distribution in the file P10_33.xlsx. Each operator can handle 15 calls per hour and costs the company 20 per hour. Each phone call that is not handled is assumed to cost the company 6 in lost profit. Considering the options of employing 6, 8, 10, 12, 14, or 16 operators, use simulation to determine the number of operators that minimizes the expected hourly cost (labor costs plus lost profits).Play Things is developing a new Lady Gaga doll. The company has made the following assumptions: The doll will sell for a random number of years from 1 to 10. Each of these 10 possibilities is equally likely. At the beginning of year 1, the potential market for the doll is two million. The potential market grows by an average of 4% per year. The company is 95% sure that the growth in the potential market during any year will be between 2.5% and 5.5%. It uses a normal distribution to model this. The company believes its share of the potential market during year 1 will be at worst 30%, most likely 50%, and at best 60%. It uses a triangular distribution to model this. The variable cost of producing a doll during year 1 has a triangular distribution with parameters 15, 17, and 20. The current selling price is 45. Each year, the variable cost of producing the doll will increase by an amount that is triangularly distributed with parameters 2.5%, 3%, and 3.5%. You can assume that once this change is generated, it will be the same for each year. You can also assume that the company will change its selling price by the same percentage each year. The fixed cost of developing the doll (which is incurred right away, at time 0) has a triangular distribution with parameters 5 million, 7.5 million, and 12 million. Right now there is one competitor in the market. During each year that begins with four or fewer competitors, there is a 25% chance that a new competitor will enter the market. Year t sales (for t 1) are determined as follows. Suppose that at the end of year t 1, n competitors are present (including Play Things). Then during year t, a fraction 0.9 0.1n of the company's loyal customers (last year's purchasers) will buy a doll from Play Things this year, and a fraction 0.2 0.04n of customers currently in the market ho did not purchase a doll last year will purchase a doll from Play Things this year. Adding these two provides the mean sales for this year. Then the actual sales this year is normally distributed with this mean and standard deviation equal to 7.5% of the mean. a. Use @RISK to estimate the expected NPV of this project. b. Use the percentiles in @ RISKs output to find an interval such that you are 95% certain that the companys actual NPV will be within this interval.A common decision is whether a company should buy equipment and produce a product in house or outsource production to another company. If sales volume is high enough, then by producing in house, the savings on unit costs will cover the fixed cost of the equipment. Suppose a company must make such a decision for a four-year time horizon, given the following data. Use simulation to estimate the probability that producing in house is better than outsourcing. If the company outsources production, it will have to purchase the product from the manufacturer for 25 per unit. This unit cost will remain constant for the next four years. The company will sell the product for 42 per unit. This price will remain constant for the next four years. If the company produces the product in house, it must buy a 500,000 machine that is depreciated on a straight-line basis over four years, and its cost of production will be 9 per unit. This unit cost will remain constant for the next four years. The demand in year 1 has a worst case of 10,000 units, a most likely case of 14,000 units, and a best case of 16,000 units. The average annual growth in demand for years 2-4 has a worst case of 7%, a most likely case of 15%, and a best case of 20%. Whatever this annual growth is, it will be the same in each of the years. The tax rate is 35%. Cash flows are discounted at 8% per year.
- Although the normal distribution is a reasonable input distribution in many situations, it does have two potential drawbacks: (1) it allows negative values, even though they may be extremely improbable, and (2) it is a symmetric distribution. Many situations are modelled better with a distribution that allows only positive values and is skewed to the right. Two of these that have been used in many real applications are the gamma and lognormal distributions. @RISK enables you to generate observations from each of these distributions. The @RISK function for the gamma distribution is RISKGAMMA, and it takes two arguments, as in =RISKGAMMA(3,10). The first argument, which must be positive, determines the shape. The smaller it is, the more skewed the distribution is to the right; the larger it is, the more symmetric the distribution is. The second argument determines the scale, in the sense that the product of it and the first argument equals the mean of the distribution. (The mean in this example is 30.) Also, the product of the second argument and the square root of the first argument is the standard deviation of the distribution. (In this example, it is 3(10=17.32.) The @RISK function for the lognormal distribution is RISKLOGNORM. It has two arguments, as in =RISKLOGNORM(40,10). These arguments are the mean and standard deviation of the distribution. Rework Example 10.2 for the following demand distributions. Do the simulated outputs have any different qualitative properties with these skewed distributions than with the triangular distribution used in the example? a. Gamma distribution with parameters 2 and 85 b. Gamma distribution with parameters 5 and 35 c. Lognormal distribution with mean 170 and standard deviation 60An automobile manufacturer is considering whether to introduce a new model called the Racer. The profitability of the Racer depends on the following factors: The fixed cost of developing the Racer is triangularly distributed with parameters 3, 4, and 5, all in billions. Year 1 sales are normally distributed with mean 200,000 and standard deviation 50,000. Year 2 sales are normally distributed with mean equal to actual year 1 sales and standard deviation 50,000. Year 3 sales are normally distributed with mean equal to actual year 2 sales and standard deviation 50,000. The selling price in year 1 is 25,000. The year 2 selling price will be 1.05[year 1 price + 50 (% diff1)] where % diff1 is the number of percentage points by which actual year 1 sales differ from expected year 1 sales. The 1.05 factor accounts for inflation. For example, if the year 1 sales figure is 180,000, which is 10 percentage points below the expected year 1 sales, then the year 2 price will be 1.05[25,000 + 50( 10)] = 25,725. Similarly, the year 3 price will be 1.05[year 2 price + 50(% diff2)] where % diff2 is the percentage by which actual year 2 sales differ from expected year 2 sales. The variable cost in year 1 is triangularly distributed with parameters 10,000, 12,000, and 15,000, and it is assumed to increase by 5% each year. Your goal is to estimate the NPV of the new car during its first three years. Assume that the company is able to produce exactly as many cars as it can sell. Also, assume that cash flows are discounted at 10%. Simulate 1000 trials to estimate the mean and standard deviation of the NPV for the first three years of sales. Also, determine an interval such that you are 95% certain that the NPV of the Racer during its first three years of operation will be within this interval.The DC Cisco office is trying to predict the revenue it will generate next week. Ten deals may close next week. The probability of each deal closing and data on the possible size of each deal (in millions of dollars) are listed in the file P11_55.xlsx. Use simulation to estimate total revenue. Based on the simulation, the company can be 95% certain that its total revenue will be between what two numbers?
- Assume a very good NBA team has a 70% chance of winning in each game it plays. During an 82-game season what is the average length of the teams longest winning streak? What is the probability that the team has a winning streak of at least 16 games? Use simulation to answer these questions, where each iteration of the simulation generates the outcomes of all 82 games.The annual demand for Prizdol, a prescription drug manufactured and marketed by the NuFeel Company, is normally distributed with mean 50,000 and standard deviation 12,000. Assume that demand during each of the next 10 years is an independent random number from this distribution. NuFeel needs to determine how large a Prizdol plant to build to maximize its expected profit over the next 10 years. If the company builds a plant that can produce x units of Prizdol per year, it will cost 16 for each of these x units. NuFeel will produce only the amount demanded each year, and each unit of Prizdol produced will sell for 3.70. Each unit of Prizdol produced incurs a variable production cost of 0.20. It costs 0.40 per year to operate a unit of capacity. a. Among the capacity levels of 30,000, 35,000, 40,000, 45,000, 50,000, 55,000, and 60,000 units per year, which level maximizes expected profit? Use simulation to answer this question. b. Using the capacity from your answer to part a, NuFeel can be 95% certain that actual profit for the 10-year period will be between what two values?Software development is an inherently risky and uncertain process. For example, there are many examples of software that couldnt be finished by the scheduled release datebugs still remained and features werent ready. (Many people believe this was the case with Office 2007.) How might you simulate the development of a software product? What random inputs would be required? Which outputs would be of interest? Which measures of the probability distributions of these outputs would be most important?
- You now have 10,000, all of which is invested in a sports team. Each year there is a 60% chance that the value of the team will increase by 60% and a 40% chance that the value of the team will decrease by 60%. Estimate the mean and median value of your investment after 50 years. Explain the large difference between the estimated mean and median.A new edition of a very popular textbook will be published a year from now. The publisher currently has 1000 copies on hand and is deciding whether to do another printing before the new edition comes out. The publisher estimates that demand for the book during the next year is governed by the probability distribution in the file P10_31.xlsx. A production run incurs a fixed cost of 15,000 plus a variable cost of 20 per book printed. Books are sold for 190 per book. Any demand that cannot be met incurs a penalty cost of 30 per book, due to loss of goodwill. Up to 1000 of any leftover books can be sold to Barnes and Noble for 45 per book. The publisher is interested in maximizing expected profit. The following print-run sizes are under consideration: 0 (no production run) to 16,000 in increments of 2000. What decision would you recommend? Use simulation with 1000 replications. For your optimal decision, the publisher can be 90% certain that the actual profit associated with remaining sales of the current edition will be between what two values?Suppose you have invested 25% of your portfolio in four different stocks. The mean and standard deviation of the annual return on each stock are shown in the file P11_46.xlsx. The correlations between the annual returns on the four stocks are also shown in this file. a. What is the probability that your portfolios annual return will exceed 30%? b. What is the probability that your portfolio will lose money during the year?