A blind taste test is conducted to determine which of two colas, Brand A or Brand B, individuals prefer. Individuals are randomly asked to drink one of the two types of cola first, followed by the other cola, and then asked to disclose the drink they prefer. Results of the taste test indicate that 59 of 100 individuals prefer Brand A. Complete parts a through c.
A blind taste test is conducted to determine which of two colas, Brand A or Brand B, individuals prefer. Individuals are randomly asked to drink one of the two types of cola first, followed by the other cola, and then asked to disclose the drink they prefer. Results of the taste test indicate that 59 of 100 individuals prefer Brand A. Complete parts a through c.

Algebra & Trigonometry with Analytic Geometry
13th Edition
ISBN:9781133382119
Author:Swokowski
Publisher:Swokowski
Chapter10: Sequences, Series, And Probability
Section10.8: Probability
Problem 32E

Related questions
Question
A blind taste test is conducted to determine which of two colas, Brand A or Brand B, individuals prefer. Individuals are randomly asked to drink one of the two types of cola first, followed by the other cola, and then asked to disclose the drink they prefer. Results of the taste test indicate that 59 of 100 individuals prefer Brand A. Complete parts a through c.
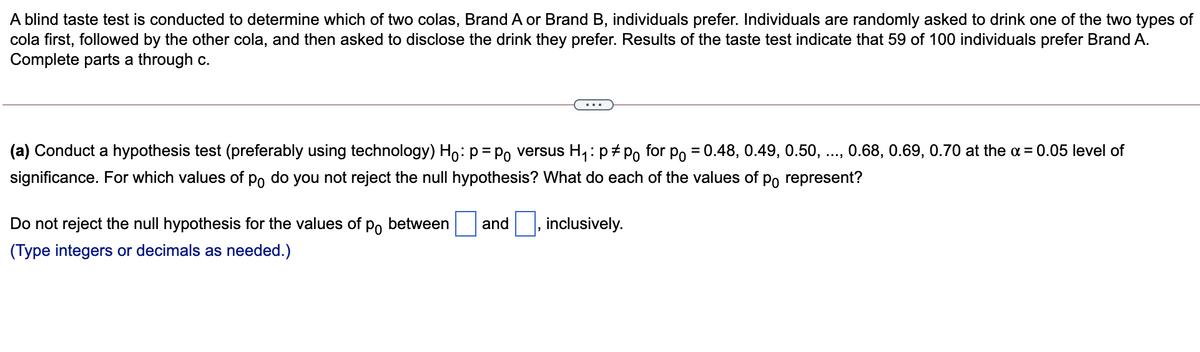
Transcribed Image Text:A blind taste test is conducted to determine which of two colas, Brand A or Brand B, individuals prefer. Individuals are randomly asked to drink one of the two types of
cola first, followed by the other cola, and then asked to disclose the drink they prefer. Results of the taste test indicate that 59 of 100 individuals prefer Brand A.
Complete parts a through c.
(a) Conduct a hypothesis test (preferably using technology) Ho: p= Po versus H,: p+ Po for po = 0.48, 0.49, 0.50,
0.68, 0.69, 0.70 at the a = 0.05 level of
...
significance. For which values of po do you not reject the null hypothesis? What do each of the values of po represent?
Do not reject the null hypothesis for the values of po between
and
inclusively.
(Type integers or decimals as needed.)
Expert Solution
This question has been solved!
Explore an expertly crafted, step-by-step solution for a thorough understanding of key concepts.

This is a popular solution!

Trending now
This is a popular solution!

Step by step
Solved in 2 steps with 2 images

Recommended textbooks for you
Algebra & Trigonometry with Analytic Geometry
Algebra
ISBN:
9781133382119
Author:
Swokowski
Publisher:
Cengage
Algebra & Trigonometry with Analytic Geometry
Algebra
ISBN:
9781133382119
Author:
Swokowski
Publisher:
Cengage