(a) Calculate and interpret a 95% confidence interval for population mean cadence. (Ro
(a) Calculate and interpret a 95% confidence interval for population mean cadence. (Ro

Holt Mcdougal Larson Pre-algebra: Student Edition 2012
1st Edition
ISBN:9780547587776
Author:HOLT MCDOUGAL
Publisher:HOLT MCDOUGAL
Chapter11: Data Analysis And Probability
Section: Chapter Questions
Problem 8CR

Related questions

Question
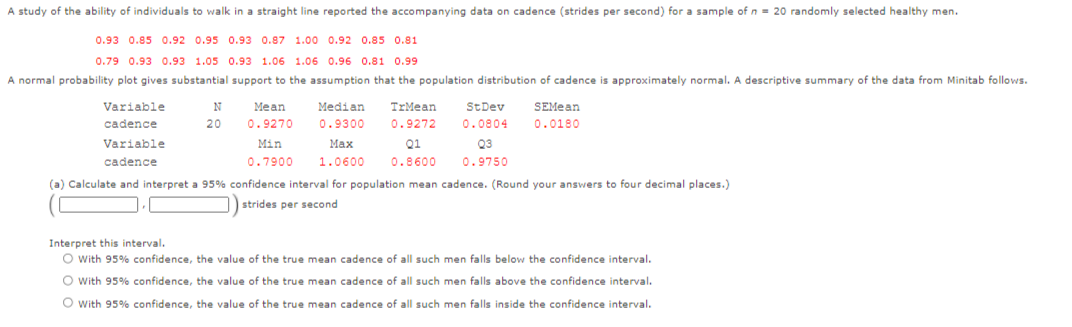
Transcribed Image Text:A study of the ability of individuals to walk in a straight line reported the accompanying data on cadence (strides per second) for a sample of n = 20 randomly selected healthy men.
0.93 0.85 0.92 0.95 0.93 0.87 1.00 0.92 0.85 0.81
0.79 0.93 0.93 1.05 0.93 1.06 1.06 0.96 0.81 0.99
A normal probability plot gives substantial support to the assumption that the population distribution of cadence is approximately normal. A descriptive summary of the data from Minitab follows.
Variable
N
Mean
Median
TrMean
StDev
SEMean
cadence
20
0.9270
0.9300
0.9272
0.0804
0.0180
Variable
Min
Мах
Q1
Q3
cadence
0.7900
1.0600
0.8600
0.9750
(a) Calculate and interpret a 95% confidence interval for population mean cadence. (Round your answers to four decimal places.)
strides per second
Interpret this interval.
O with 95% confidence, the value of the true mean cadence of all such men falls below the confidence interval.
O with 95% confidence, the value of the true mean cadence of all such men falls above the confidence interval.
O with 95% confidence, the value of the true mean cadence of all such men falls inside the confidence interval.
Expert Solution
This question has been solved!
Explore an expertly crafted, step-by-step solution for a thorough understanding of key concepts.

This is a popular solution!

Trending now
This is a popular solution!

Step by step
Solved in 2 steps

Knowledge Booster


Learn more about
Need a deep-dive on the concept behind this application? Look no further. Learn more about this topic, statistics and related others by exploring similar questions and additional content below.Recommended textbooks for you
Holt Mcdougal Larson Pre-algebra: Student Edition…
Algebra
ISBN:
9780547587776
Author:
HOLT MCDOUGAL
Publisher:
HOLT MCDOUGAL
Holt Mcdougal Larson Pre-algebra: Student Edition…
Algebra
ISBN:
9780547587776
Author:
HOLT MCDOUGAL
Publisher:
HOLT MCDOUGAL