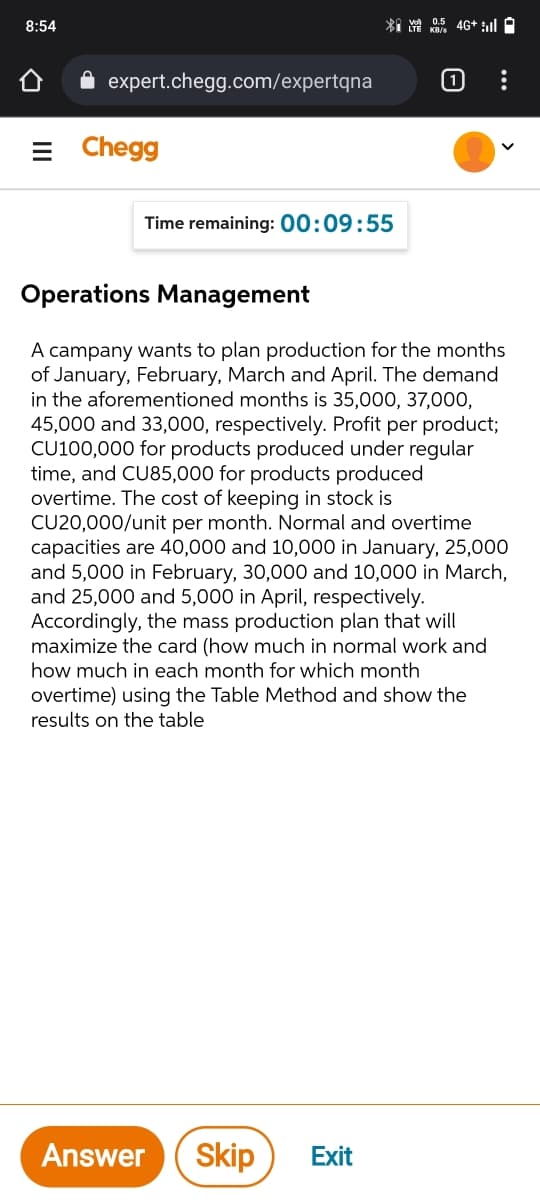
A campany wants to plan production for the months of January, February, March and April. The demand in the aforementioned months is 35,000, 37,000, 45,000 and 33,000, respectively. Profit per product; CU100,000 for products produced under regular time, and CU85,000 for products produced overtime. The cost of keeping in stock is CU20,000/unit per month. Normal and overtime capacities are 40,000 and 10,000 in January, 25,000 and 5,000 in February, 30,000 and 10,000 in March, and 25,000 and 5,000 in April, respectively. Accordingly, the mass production plan that will maximize the card (how much in normal work and how much in each month for which month overtime) using the Table Method and show the results on the table
A campany wants to plan production for the months of January, February, March and April. The demand in the aforementioned months is 35,000, 37,000, 45,000 and 33,000, respectively. Profit per product; CU100,000 for products produced under regular time, and CU85,000 for products produced overtime. The cost of keeping in stock is CU20,000/unit per month. Normal and overtime capacities are 40,000 and 10,000 in January, 25,000 and 5,000 in February, 30,000 and 10,000 in March, and 25,000 and 5,000 in April, respectively. Accordingly, the mass production plan that will maximize the card (how much in normal work and how much in each month for which month overtime) using the Table Method and show the results on the table

Practical Management Science
6th Edition
ISBN:9781337406659
Author:WINSTON, Wayne L.
Publisher:WINSTON, Wayne L.
Chapter2: Introduction To Spreadsheet Modeling
Section: Chapter Questions
Problem 20P: Julie James is opening a lemonade stand. She believes the fixed cost per week of running the stand...

Related questions
Question
please answer in 30 mins.
Transcribed Image Text:8:54
expert.chegg.com/expertqna
[1)
Chegg
Time remaining: 00:09:55
Operations Management
A campany wants to plan production for the months
of January, February, March and April. The demand
in the aforementioned months is 35,000, 37,000,
45,000 and 33,000, respectively. Profit per product;
CU100,000 for products produced under regular
time, and CU85,000 for products produced
overtime. The cost of keeping in stock is
CU20,000/unit per month. Normal and overtime
capacities are 40,000 and 10,000 in January, 25,000
and 5,000 in February, 30,000 and 10,000 in March,
and 25,000 and 5,000 in April, respectively.
Accordingly, the mass production plan that will
maximize the card (how much in normal work and
how much in each month for which month
overtime) using the Table Method and show the
results on the table
Answer
Skip
Exit
II
Expert Solution
This question has been solved!
Explore an expertly crafted, step-by-step solution for a thorough understanding of key concepts.

Step by step
Solved in 2 steps with 1 images

Recommended textbooks for you
Practical Management Science
Operations Management
ISBN:
9781337406659
Author:
WINSTON, Wayne L.
Publisher:
Cengage,

Operations Management
Operations Management
ISBN:
9781259667473
Author:
William J Stevenson
Publisher:
McGraw-Hill Education

Operations and Supply Chain Management (Mcgraw-hi…
Operations Management
ISBN:
9781259666100
Author:
F. Robert Jacobs, Richard B Chase
Publisher:
McGraw-Hill Education
Practical Management Science
Operations Management
ISBN:
9781337406659
Author:
WINSTON, Wayne L.
Publisher:
Cengage,
Operations Management
Operations Management
ISBN:
9781259667473
Author:
William J Stevenson
Publisher:
McGraw-Hill Education
Operations and Supply Chain Management (Mcgraw-hi…
Operations Management
ISBN:
9781259666100
Author:
F. Robert Jacobs, Richard B Chase
Publisher:
McGraw-Hill Education


Purchasing and Supply Chain Management
Operations Management
ISBN:
9781285869681
Author:
Robert M. Monczka, Robert B. Handfield, Larry C. Giunipero, James L. Patterson
Publisher:
Cengage Learning

Production and Operations Analysis, Seventh Editi…
Operations Management
ISBN:
9781478623069
Author:
Steven Nahmias, Tava Lennon Olsen
Publisher:
Waveland Press, Inc.