A certain statistics instructor participates in triathlons. The accompanying table lists times (in minutes and seconds) he recorded while riding a bicycle for five laps through each mile of a 3-mile loop. Use a 0.05 significance level to test the claim that it takes the same time to ride each of the miles. Does one of the miles appear to have a hill? Click the icon to view the data table of the riding times. Determine the null and alternative hypotheses. Ho H₁: Find the F test statistic. F = (Round to four decimal places as needed.) Find the P-value using the F test statistic. P-value= (Round to four decimal places as needed.) V C Mile 1 3:14 3:23 3:22 3:21 3:21 Mile 2 3:18 3:23 3:20 3:16 3:19 Mile 3 3:35 3:32 3:28 3:32 3:30 D (Note: when pasting the data into your technology, each mile row will have separate columns for each minute and second entry. You will need to convert each minute/second entry into seconds only.)
A certain statistics instructor participates in triathlons. The accompanying table lists times (in minutes and seconds) he recorded while riding a bicycle for five laps through each mile of a 3-mile loop. Use a 0.05 significance level to test the claim that it takes the same time to ride each of the miles. Does one of the miles appear to have a hill? Click the icon to view the data table of the riding times. Determine the null and alternative hypotheses. Ho H₁: Find the F test statistic. F = (Round to four decimal places as needed.) Find the P-value using the F test statistic. P-value= (Round to four decimal places as needed.) V C Mile 1 3:14 3:23 3:22 3:21 3:21 Mile 2 3:18 3:23 3:20 3:16 3:19 Mile 3 3:35 3:32 3:28 3:32 3:30 D (Note: when pasting the data into your technology, each mile row will have separate columns for each minute and second entry. You will need to convert each minute/second entry into seconds only.)

Glencoe Algebra 1, Student Edition, 9780079039897, 0079039898, 2018
18th Edition
ISBN:9780079039897
Author:Carter
Publisher:Carter
Chapter10: Statistics
Section10.4: Distributions Of Data
Problem 19PFA

Related questions
Question
dal
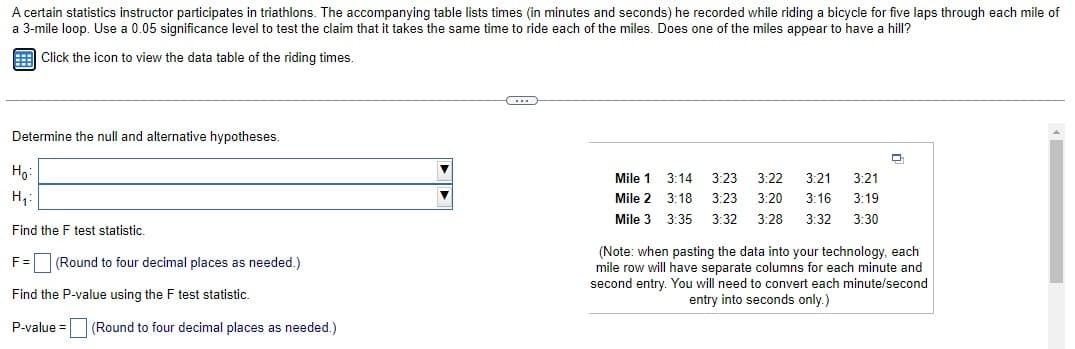
Transcribed Image Text:A certain statistics instructor participates in triathlons. The accompanying table lists times (in minutes and seconds) he recorded while riding a bicycle for five laps through each mile of
a 3-mile loop. Use a 0.05 significance level to test the claim that it takes the same time to ride each of the miles. Does one of the miles appear to have a hill?
Click the icon to view the data table of the riding times.
Determine the null and alternative hypotheses.
Ho:
H₁:
Find the F test statistic.
F = (Round to four decimal places as needed.)
Find the P-value using the F test statistic.
P-value= (Round to four decimal places as needed.)
...
Mile 1
Mile 2
Mile 3
3:14 3:23 3:22 3:21 3:21
3:18 3:23 3:20 3:16 3:19
3:35 3:32 3:28 3:32 3:30
(Note: when pasting the data into your technology, each
mile row will have separate columns for each minute and
second entry. You will need to convert each minute/second
entry into seconds only.)
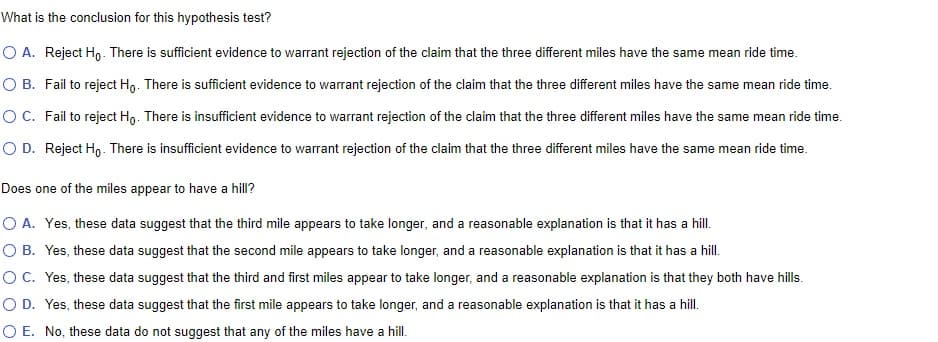
Transcribed Image Text:What is the conclusion for this hypothesis test?
O A. Reject Ho. There is sufficient evidence to warrant rejection of the claim that the three different miles have the same mean ride time.
O B. Fail to reject Ho. There is sufficient evidence to warrant rejection of the claim that the three different miles have the same mean ride time.
O C. Fail to reject Ho. There is insufficient evidence to warrant rejection of the claim that the three different miles have the same mean ride time.
O D. Reject Ho. There is insufficient evidence to warrant rejection of the claim that the three different miles have the same mean ride time.
Does one of the miles appear to have a hill?
O A. Yes, these data suggest that the third mile appears to take longer, and a reasonable explanation is that it has a hill.
O B. Yes, these data suggest that the second mile appears to take longer, and a reasonable explanation is that it has a hill.
O C. Yes, these data suggest that the third and first miles appear to take longer, and a reasonable explanation is that they both have hills.
O D. Yes, these data suggest that the first mile appears to take longer, and a reasonable explanation is that it has a hill.
O E. No, these data do not suggest that any of the miles have a hill.
Expert Solution
This question has been solved!
Explore an expertly crafted, step-by-step solution for a thorough understanding of key concepts.

This is a popular solution!

Trending now
This is a popular solution!

Step by step
Solved in 4 steps with 13 images

Recommended textbooks for you
Glencoe Algebra 1, Student Edition, 9780079039897…
Algebra
ISBN:
9780079039897
Author:
Carter
Publisher:
McGraw Hill
Glencoe Algebra 1, Student Edition, 9780079039897…
Algebra
ISBN:
9780079039897
Author:
Carter
Publisher:
McGraw Hill