A certain type of candy is reported to be distributed with the color percentages shown in the table below. The number of each color in a random bag of candy is also shown below. Use the chi-square goodness-of-fit test to decide whether the color distribution differs from the reported distribution. Use a = 0.05. Color Percentage Frequency Green 17 21 Orange 19 23 Yellow 13 8 Blue 25 30 Determine the null and alternative hypotheses. Choose the correct answer below. O A. Ho: The color distribution is the same as that reported. H₂: The color distribution is different from that reported. OB. Ho: The color distribution is different from that reported. Ha: The color distribution is the same as that reported. OC. Ho: The frequency is the same for each color. H₂: The frequency is different for each color. O D. Ho: The frequency is different for each color. H₂: The frequency is the same for each color. Compute the value of the test statistic, x². x² Red 13 12 Brown 13 6
A certain type of candy is reported to be distributed with the color percentages shown in the table below. The number of each color in a random bag of candy is also shown below. Use the chi-square goodness-of-fit test to decide whether the color distribution differs from the reported distribution. Use a = 0.05. Color Percentage Frequency Green 17 21 Orange 19 23 Yellow 13 8 Blue 25 30 Determine the null and alternative hypotheses. Choose the correct answer below. O A. Ho: The color distribution is the same as that reported. H₂: The color distribution is different from that reported. OB. Ho: The color distribution is different from that reported. Ha: The color distribution is the same as that reported. OC. Ho: The frequency is the same for each color. H₂: The frequency is different for each color. O D. Ho: The frequency is different for each color. H₂: The frequency is the same for each color. Compute the value of the test statistic, x². x² Red 13 12 Brown 13 6

Glencoe Algebra 1, Student Edition, 9780079039897, 0079039898, 2018
18th Edition
ISBN:9780079039897
Author:Carter
Publisher:Carter
Chapter10: Statistics
Section10.4: Distributions Of Data
Problem 19PFA

Related questions
Question
Find the P-value.
P=
(Round to three decimal places as needed.)
Do the data provide sufficient evidence to conclude that the color distribution differs from the reported distribution?
Yes,
because there is not sufficient evidence to reject the null hypothesis.Yes,
because there is sufficient evidence to reject the null hypothesis.No,
because there is sufficient evidence to reject the null hypothesis.No,
because there is not sufficient evidence to reject the null hypothesis.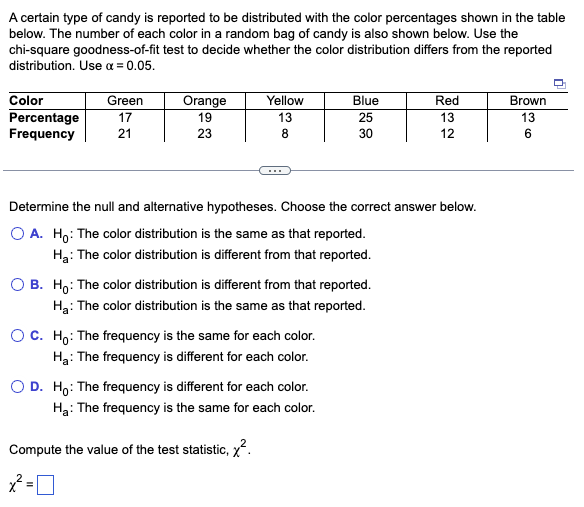
Transcribed Image Text:A certain type of candy is reported to be distributed with the color percentages shown in the table
below. The number of each color in a random bag of candy is also shown below. Use the
chi-square goodness-of-fit test to decide whether the color distribution differs from the reported
distribution. Use a = 0.05.
Color
Percentage
Frequency
Green
17
21
Orange
19
23
Yellow
13
8
Determine the null and alternative hypotheses. Choose the correct answer below.
O A. Ho: The color distribution is the same as that reported.
H₂: The color distribution is different from that reported.
O B. Ho: The color distribution is different from that reported.
H₂: The color distribution is the same as that reported.
OC. Ho: The frequency is the same for each color.
Ha: The frequency is different for each color.
Blue
25
30
O D. Ho: The frequency is different for each color.
H₂: The frequency is the same for each color.
Compute the value of the test statistic, ².
x²=0
Red
13
12
Brown
13
6
Expert Solution
This question has been solved!
Explore an expertly crafted, step-by-step solution for a thorough understanding of key concepts.

This is a popular solution!

Trending now
This is a popular solution!

Step by step
Solved in 5 steps with 1 images

Recommended textbooks for you
Glencoe Algebra 1, Student Edition, 9780079039897…
Algebra
ISBN:
9780079039897
Author:
Carter
Publisher:
McGraw Hill
Glencoe Algebra 1, Student Edition, 9780079039897…
Algebra
ISBN:
9780079039897
Author:
Carter
Publisher:
McGraw Hill