A chain of restaurants has historically had a mean wait time of 5 minutes for its customers. Recently, the restaurant added several very popular dishes back to their menu. Due to this, the manager suspects the wait time, µ, has increased. He takes a random sample of 36 customers. The mean wait time for the sample is 5.4 minutes. Assume the population standard deviation for the wait times is known to be 1.3 minutes. Can the manager conclude that the mean wait time is now greater than 5 minutes? Perform a hypothesis test, using the 0.10 level of significance. (a) State the null hypothesis H, and the alternative hypothesis H1. Hg: 0 H;: 0 OSO O=0 (b) Perform a Z-test and find the p-value. Here is some information to help you with your Z-test. • The value of the test statistic is given by • The p-value is the area under the curve to the right of the value of the test statistic. Standard Normal Distribution 0.4 Step 1: Select one-tailed or two-tailed. O One-tailed Two-tailed
A chain of restaurants has historically had a mean wait time of 5 minutes for its customers. Recently, the restaurant added several very popular dishes back to their menu. Due to this, the manager suspects the wait time, µ, has increased. He takes a random sample of 36 customers. The mean wait time for the sample is 5.4 minutes. Assume the population standard deviation for the wait times is known to be 1.3 minutes. Can the manager conclude that the mean wait time is now greater than 5 minutes? Perform a hypothesis test, using the 0.10 level of significance. (a) State the null hypothesis H, and the alternative hypothesis H1. Hg: 0 H;: 0 OSO O=0 (b) Perform a Z-test and find the p-value. Here is some information to help you with your Z-test. • The value of the test statistic is given by • The p-value is the area under the curve to the right of the value of the test statistic. Standard Normal Distribution 0.4 Step 1: Select one-tailed or two-tailed. O One-tailed Two-tailed

Chapter9: Sequences, Probability And Counting Theory
Section9.7: Probability
Problem 1SE: What term is used to express the likelihood of an event occurring? Are there restrictions on its...

Related questions
Question
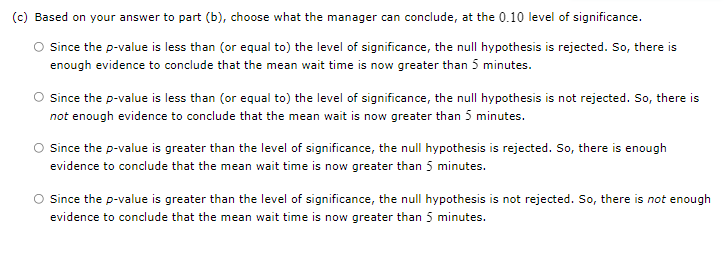
Transcribed Image Text:(c) Based on your answer to part (b), choose what the manager can conclude, at the 0.10 level of significance.
O Since the p-value is less than (or equal to) the level of significance, the null hypothesis is rejected. So, there is
enough evidence to conclude that the mean wait time is now greater than 5 minutes.
Since the p-value is less than (or equal to) the level of significance, the null hypothesis is not rejected. So, there is
not enough evidence to conclude that the mean wait is now greater than 5 minutes.
O since the p-value is greater than the level of significance, the null hypothesis is rejected. So, there is enough
evidence to conclude that the mean wait time is now greater than 5 minutes.
O Since the p-value is greater than the level of significance, the null hypothesis is not rejected. So, there is not enough
evidence to conclude that the mean wait time is now greater than 5 minutes.
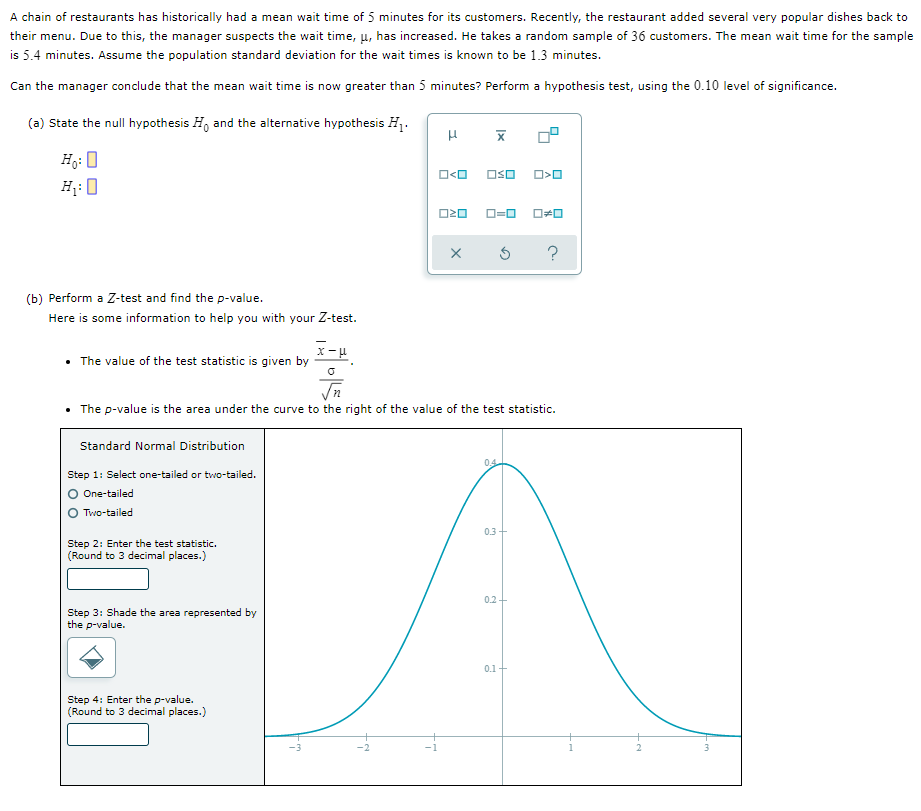
Transcribed Image Text:A chain of restaurants has historically had a mean wait time of 5 minutes for its customers. Recently, the restaurant added several very popular dishes back to
their menu. Due to this, the manager suspects the wait time, µ, has increased. He takes a random sample of 36 customers. The mean wait time for the sample
is 5.4 minutes. Assume the population standard deviation for the wait times is known to be 1.3 minutes.
Can the manager conclude that the mean wait time is now greater than 5 minutes? Perform a hypothesis test, using the 0.10 level of significance.
(a) State the null hypothesis H, and the alternative hypothesis H1.
Hg: 0
H;: 0
OSO
O=0
(b) Perform a Z-test and find the p-value.
Here is some information to help you with your Z-test.
• The value of the test statistic is given by
• The p-value is the area under the curve to the right of the value of the test statistic.
Standard Normal Distribution
0.4
Step 1: Select one-tailed or two-tailed.
O One-tailed
Two-tailed
0.3
Step 2: Enter the test statistic.
(Round to 3 decimal places.)
0.2
Step 3: Shade the area represented by
the p-value.
0.1+
Step 4: Enter the p-value.
(Round to 3 decimal places.)
-1
2
Expert Solution
This question has been solved!
Explore an expertly crafted, step-by-step solution for a thorough understanding of key concepts.

This is a popular solution!

Trending now
This is a popular solution!

Step by step
Solved in 2 steps with 1 images

Recommended textbooks for you