A city police department wants to know if the new law enacted to curb traffic violations by its citizens has been effective in decreasing the number of car accidents. They randomly sampled a week, before and after the law was passed and counted the number of accidents for each day in each week. Here are the results: a. Are the data paired? Give comments! b. Compute the mean of the difference. c. Compute the standard deviation of the difference. d. Is the hypothesis test one- or two-tailed? Give comments!


A city police department wants to know if the new law enacted to curb traffic violations by its citizens has been effective in decreasing the number of car accidents. They randomly sampled a week, before and after the law was passed and counted the number of accidents for each day in each week. Here are the results:
a. Are the data paired? Give comments!
b. Compute the mean of the difference.
c. Compute the standard deviation of the difference.
d. Is the hypothesis test one- or two-tailed? Give comments!

Hi! Thank you for posting the question. Since your question has more than three sub-parts, we have solved the first three sub-parts for you. If you need help with any other parts, please re-post the question and mention the part you need help with.
a)
Requirements for a paired t-test:
- The samples must be paired sample and drawn randomly from normally distributed populations.
On observing the given information, the data is paired. Because the result of sample 2 is dependent of sample 1. Therefore, the data are paired.
In this scenario, it is appropriate to use paired t test.
b)
The mean of the difference is:
The following table shows the necessary calculations for finding the test statistic:
Here, di=Before–After
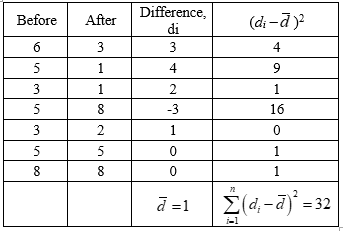
From the table, the mean of the difference is 1.

Step by step
Solved in 3 steps with 2 images


