(a) Click on "Take Sample" to see the results from the random sample. Number Proportion Take Sample Says the corporation is a great place to work 63 0.84 Does not say the corporation is a great place to work 12 0.16 Enter the values of the sample size, the point estimate of the population proportion, and the critical value you need for your 99% confidence Interval. (Choose the correct critical value from the table of critical values provided.) When you are done, select "Compute". Sample size: Point estimate: 0 Critical value: Compute Standard error: Margin of error: Confidence level Critical value 99% F0.005 -2.576 99% confidence interval: 95% F0.025 -1.960 90% F0.050-1.645 (b) Based on your sample, enter the lower and upper limits to graph the 99% confidence interval for the population proportion of all employees who say the corporation is a great place to work. 0.000 0.000 99% confidence interval: 1.000 1.000
(a) Click on "Take Sample" to see the results from the random sample. Number Proportion Take Sample Says the corporation is a great place to work 63 0.84 Does not say the corporation is a great place to work 12 0.16 Enter the values of the sample size, the point estimate of the population proportion, and the critical value you need for your 99% confidence Interval. (Choose the correct critical value from the table of critical values provided.) When you are done, select "Compute". Sample size: Point estimate: 0 Critical value: Compute Standard error: Margin of error: Confidence level Critical value 99% F0.005 -2.576 99% confidence interval: 95% F0.025 -1.960 90% F0.050-1.645 (b) Based on your sample, enter the lower and upper limits to graph the 99% confidence interval for the population proportion of all employees who say the corporation is a great place to work. 0.000 0.000 99% confidence interval: 1.000 1.000

Essentials of Business Analytics (MindTap Course List)
2nd Edition
ISBN:9781305627734
Author:Jeffrey D. Camm, James J. Cochran, Michael J. Fry, Jeffrey W. Ohlmann, David R. Anderson
Publisher:Jeffrey D. Camm, James J. Cochran, Michael J. Fry, Jeffrey W. Ohlmann, David R. Anderson
Chapter6: Statistical Inference
Section: Chapter Questions
Problem 6P: In this chapter we showed how a simple random sample of 30 EAI employees can be used to develop...

Related questions
Question
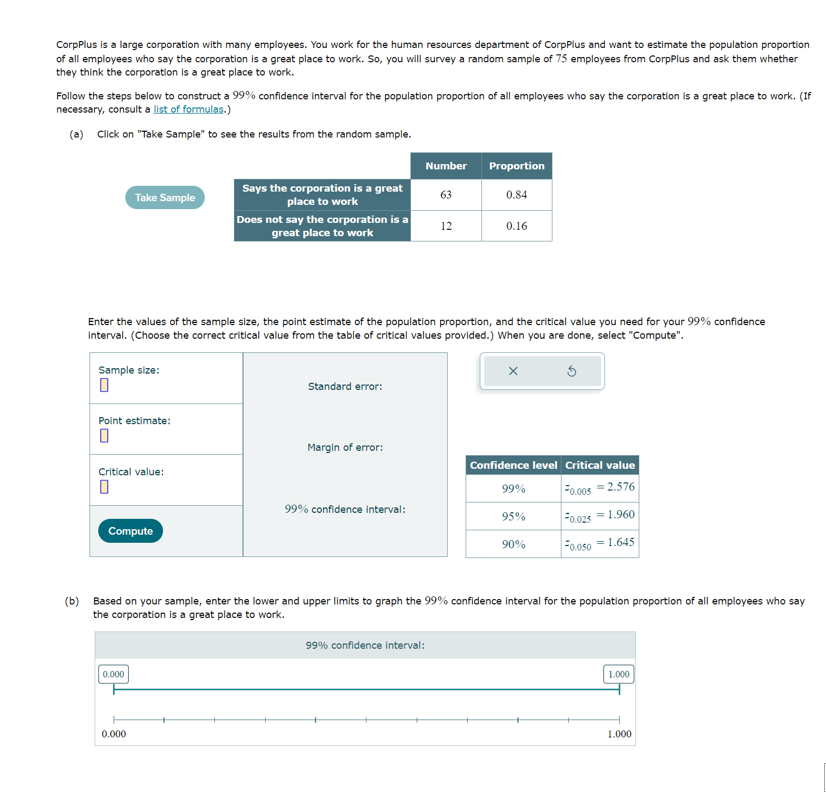
Transcribed Image Text:CorpPlus is a large corporation with many employees. You work for the human resources department of CorpPlus and want to estimate the population proportion
of all employees who say the corporation is a great place to work. So, you will survey a random sample of 75 employees from CorpPlus and ask them whether
they think the corporation is a great place to work.
Follow the steps below to construct a 99% confidence interval for the population proportion of all employees who say the corporation is a great place to work. (If
necessary, consult a list of formulas.)
(a) Click on "Take Sample" to see the results from the random sample.
Number
Proportion
Take Sample
Says the corporation is a great
place to work
Does not say the corporation is a
great place to work
63
0.84
12
0.16
Enter the values of the sample size, the point estimate of the population proportion, and the critical value you need for your 99% confidence
interval. (Choose the correct critical value from the table of critical values provided.) When you are done, select "Compute".
Sample size:
Standard error:
Point estimate:
Margin of error:
Critical value:
Confidence level Critical value
99%
F0.005 -2.576
99% confidence interval:
95%
F0.025 1.960
Compute
90%
F0.0501.645
(b) Based on your sample, enter the lower and upper limits to graph the 99% confidence interval for the population proportion of all employees who say
the corporation is a great place to work.
0.000
0.000
99% confidence interval:
1.000
1.000
Expert Solution
This question has been solved!
Explore an expertly crafted, step-by-step solution for a thorough understanding of key concepts.

Step by step
Solved in 4 steps with 2 images

Recommended textbooks for you
Essentials of Business Analytics (MindTap Course …
Statistics
ISBN:
9781305627734
Author:
Jeffrey D. Camm, James J. Cochran, Michael J. Fry, Jeffrey W. Ohlmann, David R. Anderson
Publisher:
Cengage Learning
Essentials of Business Analytics (MindTap Course …
Statistics
ISBN:
9781305627734
Author:
Jeffrey D. Camm, James J. Cochran, Michael J. Fry, Jeffrey W. Ohlmann, David R. Anderson
Publisher:
Cengage Learning