A company is evaluating its manufacturing system to produce steel rods for a new customer. Fif- teen samples, cach containing five steel rods, were taken from the process. The length of each rod in the samples was measured and is shown in the following table: Sample Rod 1 Rod 2 Rod 3 Rod 4 Rod 5 10.001 10.013 10.009 9.999 9.992 10.002 10.001 9.992 10.001 9.989 10,001 10.002 9.993 9.999 10.011 9.999 4 10.012 10.001 10.002 9.989 9.998 9.997 10.003 9.999 9.995 10.001 6. 9.995 10.003 10.002 9.993 10,008 7 9.999 9.998 10.002 9.999 9.997 8. 10.002 10.001 9.993 10.001 9. 10,021 10.008 9.992 9.989 9.996 10 10.001 10.010 10.002 10.003 10.006 11 10.002 10.008 9.992 9.999 10,005 10.001 12 9.992 9.996 9.999 9.989 13 10.001 10.009 10.001 9.992 10.002 14 10,003 9.991 10.002 9.999 10,003 15 9.998 10.002 9.991 10.003 10.001
A company is evaluating its manufacturing system to produce steel rods for a new customer. Fif- teen samples, cach containing five steel rods, were taken from the process. The length of each rod in the samples was measured and is shown in the following table: Sample Rod 1 Rod 2 Rod 3 Rod 4 Rod 5 10.001 10.013 10.009 9.999 9.992 10.002 10.001 9.992 10.001 9.989 10,001 10.002 9.993 9.999 10.011 9.999 4 10.012 10.001 10.002 9.989 9.998 9.997 10.003 9.999 9.995 10.001 6. 9.995 10.003 10.002 9.993 10,008 7 9.999 9.998 10.002 9.999 9.997 8. 10.002 10.001 9.993 10.001 9. 10,021 10.008 9.992 9.989 9.996 10 10.001 10.010 10.002 10.003 10.006 11 10.002 10.008 9.992 9.999 10,005 10.001 12 9.992 9.996 9.999 9.989 13 10.001 10.009 10.001 9.992 10.002 14 10,003 9.991 10.002 9.999 10,003 15 9.998 10.002 9.991 10.003 10.001

Practical Management Science
6th Edition
ISBN:9781337406659
Author:WINSTON, Wayne L.
Publisher:WINSTON, Wayne L.
Chapter2: Introduction To Spreadsheet Modeling
Section: Chapter Questions
Problem 20P: Julie James is opening a lemonade stand. She believes the fixed cost per week of running the stand...

Related questions

Question
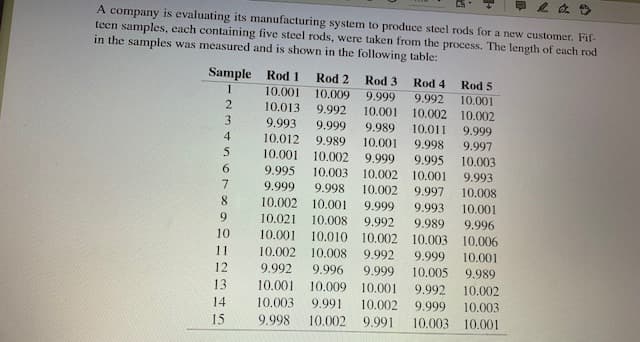
Transcribed Image Text:A company is evaluating its manufacturing system to produce steel rods for a new customer. Fif-
teen samples, cach containing five steel rods, were taken from the process. The length of each rod
in the samples was measured and is shown in the following table:
Sample Rod 1
10.001
Rod 2
Rod 3
Rod 4
Rod 5
1
10.009
9.999
10.001
9.992
10.002
10.013
9.992
10.001
10.002
9.999
9.997
3
9.993
10.012
9.999
9.989
10.011
4
9.989
10,001
9.998
5
10.001
10.002
9.999
9.995
10.003
9.993
6.
9.995
10.003
10.002
10.001
7.
9.999
9.998
10.002
9.997
9.993
10.008
8.
10.002
10.001
9.999
10.001
9
10.021
10.008
9.992
9.989
9.996
10
10.001
10.010 10.002
10.003
10.006
11
10.002
10.008
9.992
9.999
10.001
12
9.992
9.996
9.999
10.005
9.989
13
10.001
10.009 10.001
9.992
10.002
14
10.003
9.991
10.002
9.999
10.003
15
9.998
10.002
9.991
10.003
10.001
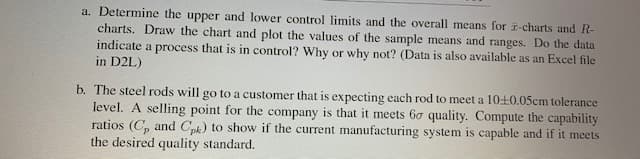
Transcribed Image Text:a. Determine the upper and lower control limits and the overall means for I-charts and R-
charts. Draw the chart and plot the values of the sample means and ranges. Do the data.
indicate a process that is in control? Why or why not? (Data is also available as an Excel file
in D2L)
b. The steel rods will go to a customer that is expecting each rod to meet a 10+0.05cm tolerance
level. A selling point for the company is that it meets 60 quality. Compute the capability
ratios (C, and Cuk) to show if the current manufacturing system is capable and if it meets
the desired quality standard.
Expert Solution
This question has been solved!
Explore an expertly crafted, step-by-step solution for a thorough understanding of key concepts.

Step by step
Solved in 2 steps with 36 images

Knowledge Booster


Learn more about
Need a deep-dive on the concept behind this application? Look no further. Learn more about this topic, operations-management and related others by exploring similar questions and additional content below.Recommended textbooks for you
Practical Management Science
Operations Management
ISBN:
9781337406659
Author:
WINSTON, Wayne L.
Publisher:
Cengage,

Operations Management
Operations Management
ISBN:
9781259667473
Author:
William J Stevenson
Publisher:
McGraw-Hill Education

Operations and Supply Chain Management (Mcgraw-hi…
Operations Management
ISBN:
9781259666100
Author:
F. Robert Jacobs, Richard B Chase
Publisher:
McGraw-Hill Education
Practical Management Science
Operations Management
ISBN:
9781337406659
Author:
WINSTON, Wayne L.
Publisher:
Cengage,
Operations Management
Operations Management
ISBN:
9781259667473
Author:
William J Stevenson
Publisher:
McGraw-Hill Education
Operations and Supply Chain Management (Mcgraw-hi…
Operations Management
ISBN:
9781259666100
Author:
F. Robert Jacobs, Richard B Chase
Publisher:
McGraw-Hill Education


Purchasing and Supply Chain Management
Operations Management
ISBN:
9781285869681
Author:
Robert M. Monczka, Robert B. Handfield, Larry C. Giunipero, James L. Patterson
Publisher:
Cengage Learning

Production and Operations Analysis, Seventh Editi…
Operations Management
ISBN:
9781478623069
Author:
Steven Nahmias, Tava Lennon Olsen
Publisher:
Waveland Press, Inc.