A company operates in a competitive market, selling each unit of output for a price of $20 and paying the market wage of $270 per day for each worker it hires.
A company operates in a competitive market, selling each unit of output for a price of $20 and paying the market wage of $270 per day for each worker it hires.

Principles of Microeconomics
7th Edition
ISBN:9781305156050
Author:N. Gregory Mankiw
Publisher:N. Gregory Mankiw
Chapter18: The Markets For The Factor Of Production
Section: Chapter Questions
Problem 7PA

Related questions
Question
Please help (it's just one question)
Transcribed Image Text:00
B.
80
WAGE (Dollars per worker)
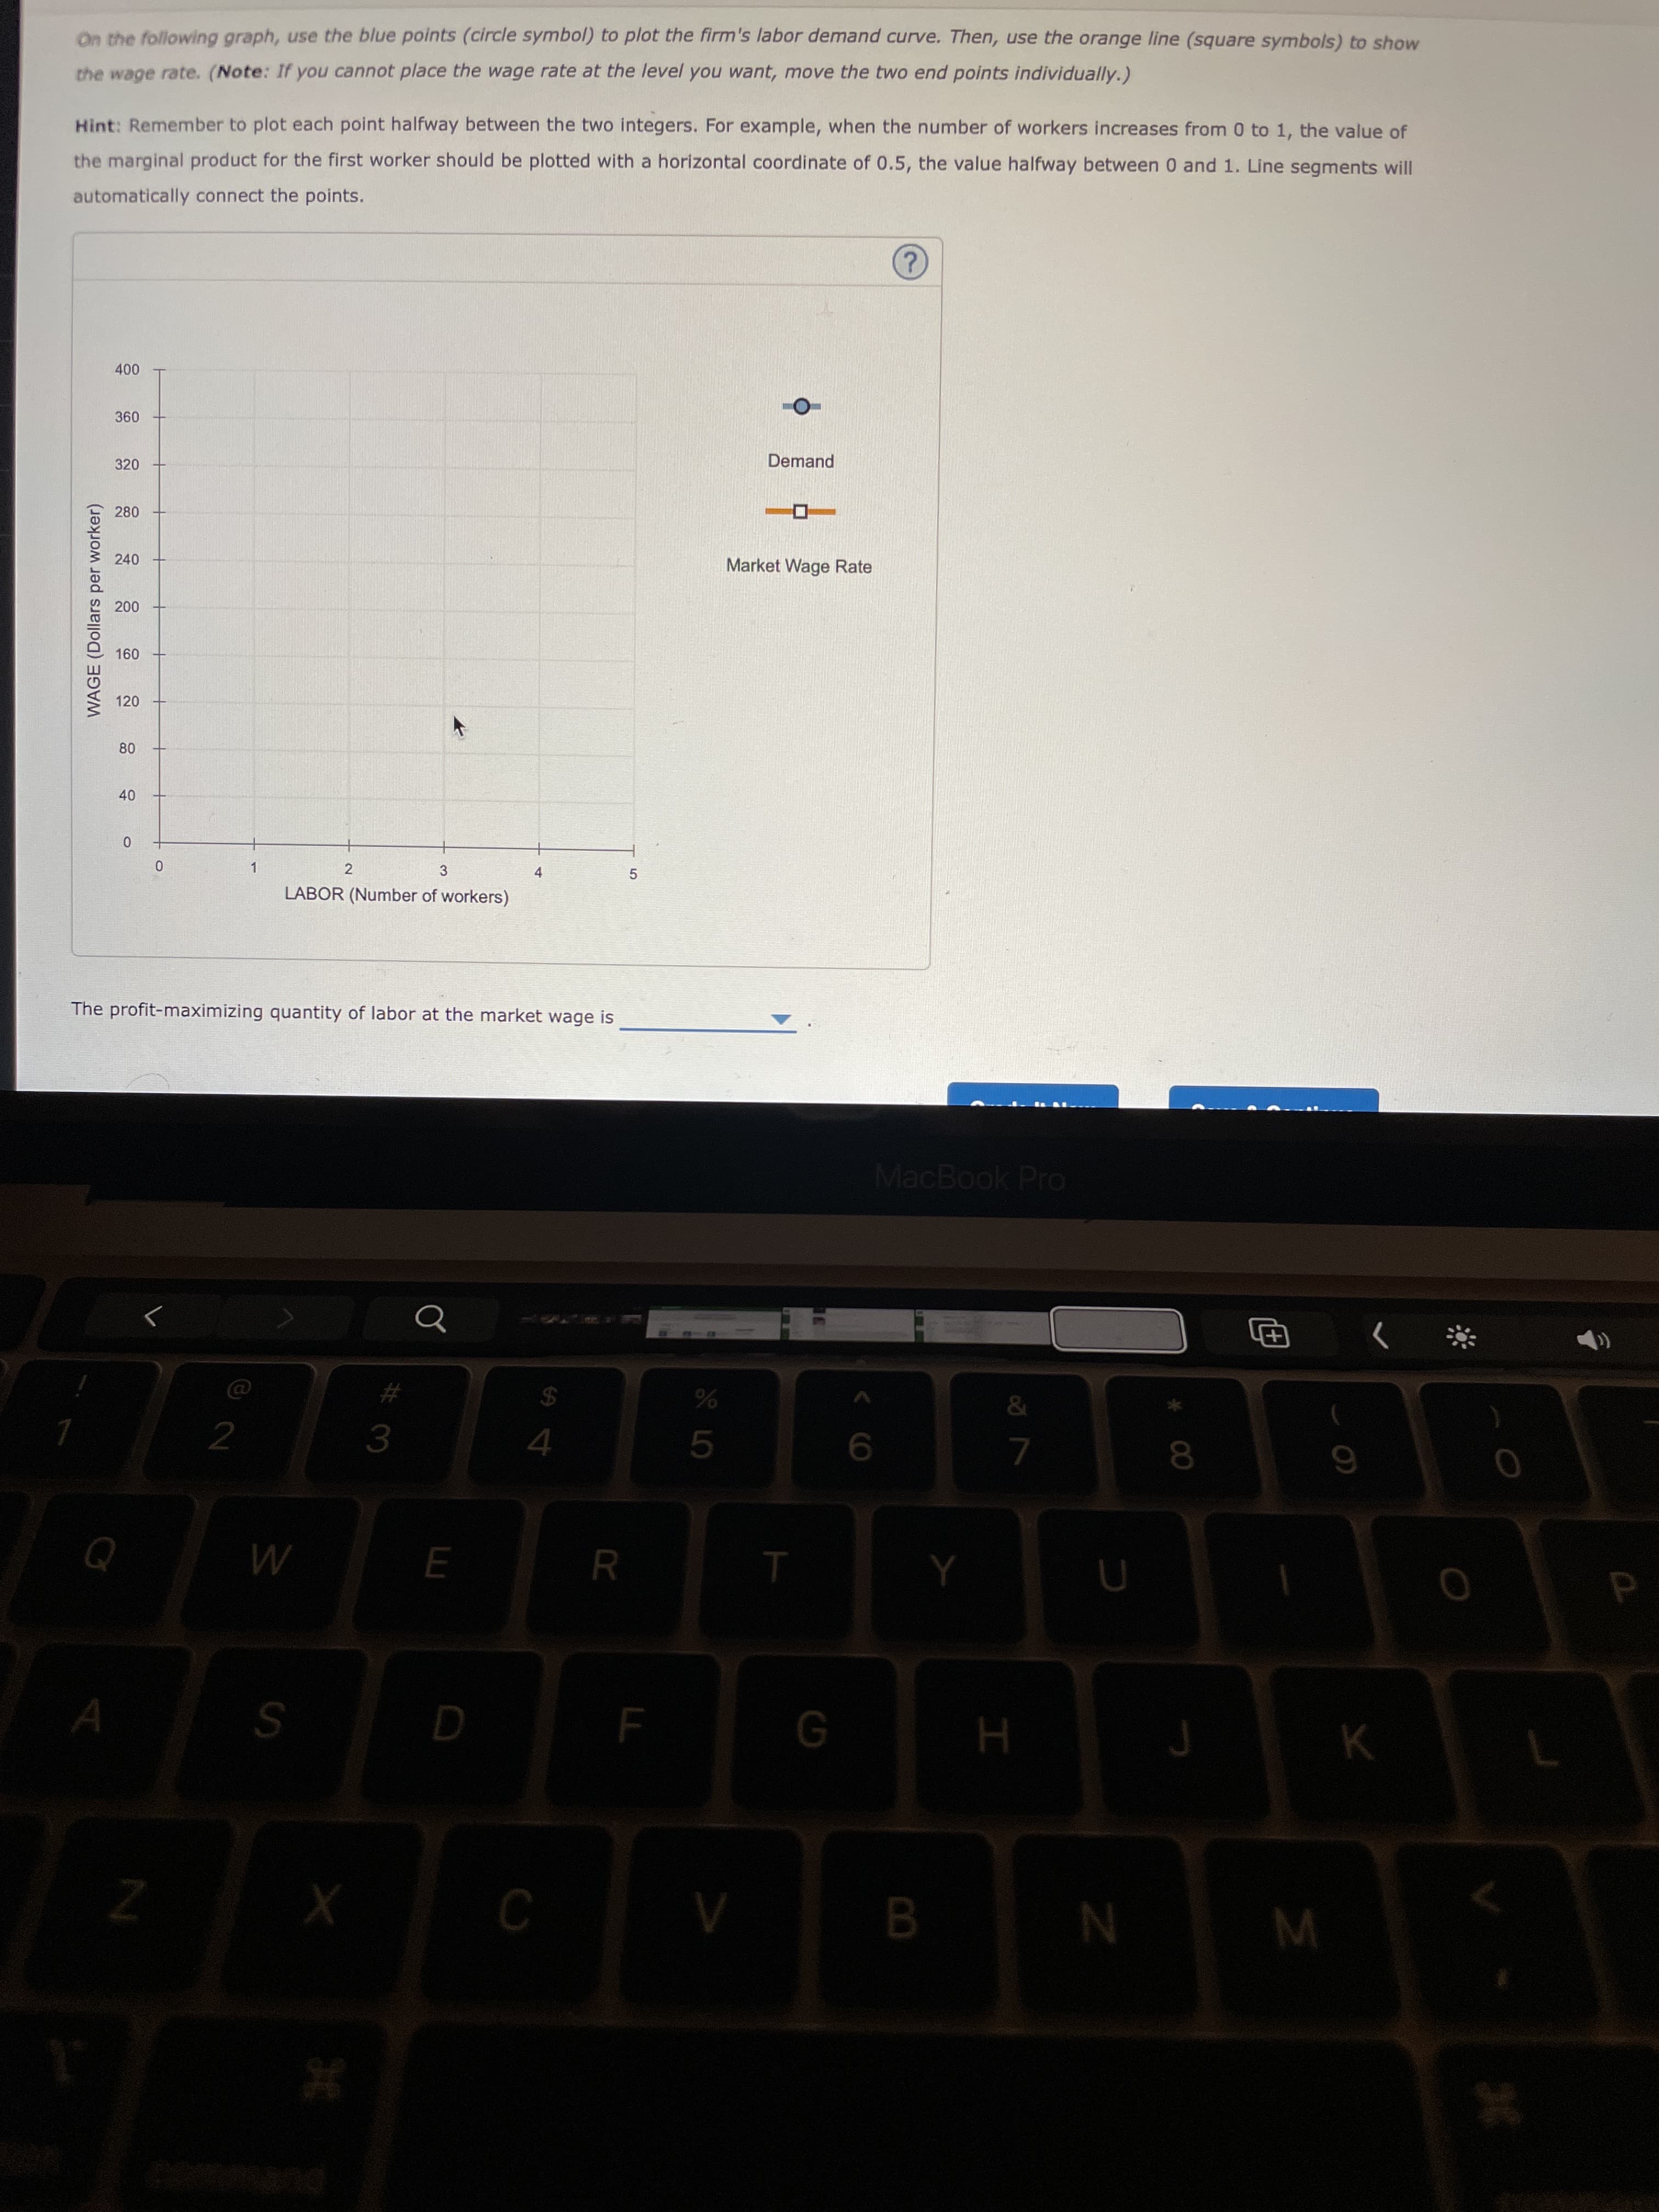
On the following graph, use the blue points (circle symbol) to plot the firm's labor demand curve. Then, use the orange line (square symbols) to show
the wage rate. (Note: If you cannot place the wage rate at the level you want, move the two end points individually.)
Hint: Remember to plot each point halfway between the two integers. For example, when the number of workers increases from 0 to 1, the value of
the marginal product for the first worker should be plotted with a horizontal coordinate of 0.5, the value halfway between 0 and 1. Line segments will
automatically connect the points.
Demand
320
280
240
Market Wage Rate
120
40
1.
LABOR (Number of workers)
3.
4.
2.
5.
The profit-maximizing quantity of labor at the market wage is
MacBook Pro
$4
4
&
%23
5.
9.
7.
R.

Transcribed Image Text:30
2. Graphing demand for labor and computing the optimal quantity of labor demanded
A company operates in a competitive market, selling each unit of output for a price of $20 and paying the market wage of $270 per day for each
worker it hires.
In the following table, complete the column for the value of the marginal product of labor (VMPL) at each quantity of workers.
Marginal Product of Labor
Value of the Marginal Product of Labor
Output
(Units of output)
Labor
(Number of workers)
(Units of output)
(Dollars)
1.
2
57
3.
15
* 72
4.
12
84
5.
On the following graph, use the blue points (circle symbol) to plot the firm's labor demand curve. Then, use the orange line (square symbols) to show
the wage rate. (Note: If you cannot place the wage rate at the level you want, move the two end points individually.)
Hint: Remember to plot each point halfway between the two integers. For example, when the number of workers increases from 0 to 1, the value of
the marginal product for the first worker should be plotted with a horizontal coordinate of 0.5, the value halfway between 0 and 1. Line segments will
automatically connect the points.
MacBook Pro
%23
%24
3.
5.
R.
B.
Expert Solution
This question has been solved!
Explore an expertly crafted, step-by-step solution for a thorough understanding of key concepts.

This is a popular solution!

Trending now
This is a popular solution!

Step by step
Solved in 2 steps with 1 images

Knowledge Booster


Learn more about
Need a deep-dive on the concept behind this application? Look no further. Learn more about this topic, economics and related others by exploring similar questions and additional content below.Recommended textbooks for you
Principles of Microeconomics
Economics
ISBN:
9781305156050
Author:
N. Gregory Mankiw
Publisher:
Cengage Learning

Principles of Economics 2e
Economics
ISBN:
9781947172364
Author:
Steven A. Greenlaw; David Shapiro
Publisher:
OpenStax

Principles of Microeconomics
Economics
ISBN:
9781305156050
Author:
N. Gregory Mankiw
Publisher:
Cengage Learning
Principles of Economics 2e
Economics
ISBN:
9781947172364
Author:
Steven A. Greenlaw; David Shapiro
Publisher:
OpenStax


Microeconomics: Private and Public Choice (MindTa…
Economics
ISBN:
9781305506893
Author:
James D. Gwartney, Richard L. Stroup, Russell S. Sobel, David A. Macpherson
Publisher:
Cengage Learning