A company wants to know if more than 80% of people approve of their new advertising campaign. A random sample of 150 likely voters is taken, and 124 of them (83%) say that they support the proposition. In order to conduct a statistical analysis, the One Proportion applet was used to see if the candidate's claim is plausible. Use the dot plot generated by the applet (pictured above) to answer the questions.
A company wants to know if more than 80% of people approve of their new advertising campaign. A random sample of 150 likely voters is taken, and 124 of them (83%) say that they support the proposition. In order to conduct a statistical analysis, the One Proportion applet was used to see if the candidate's claim is plausible. Use the dot plot generated by the applet (pictured above) to answer the questions.

Glencoe Algebra 1, Student Edition, 9780079039897, 0079039898, 2018
18th Edition
ISBN:9780079039897
Author:Carter
Publisher:Carter
Chapter10: Statistics
Section10.4: Distributions Of Data
Problem 20PFA

Related questions
Question
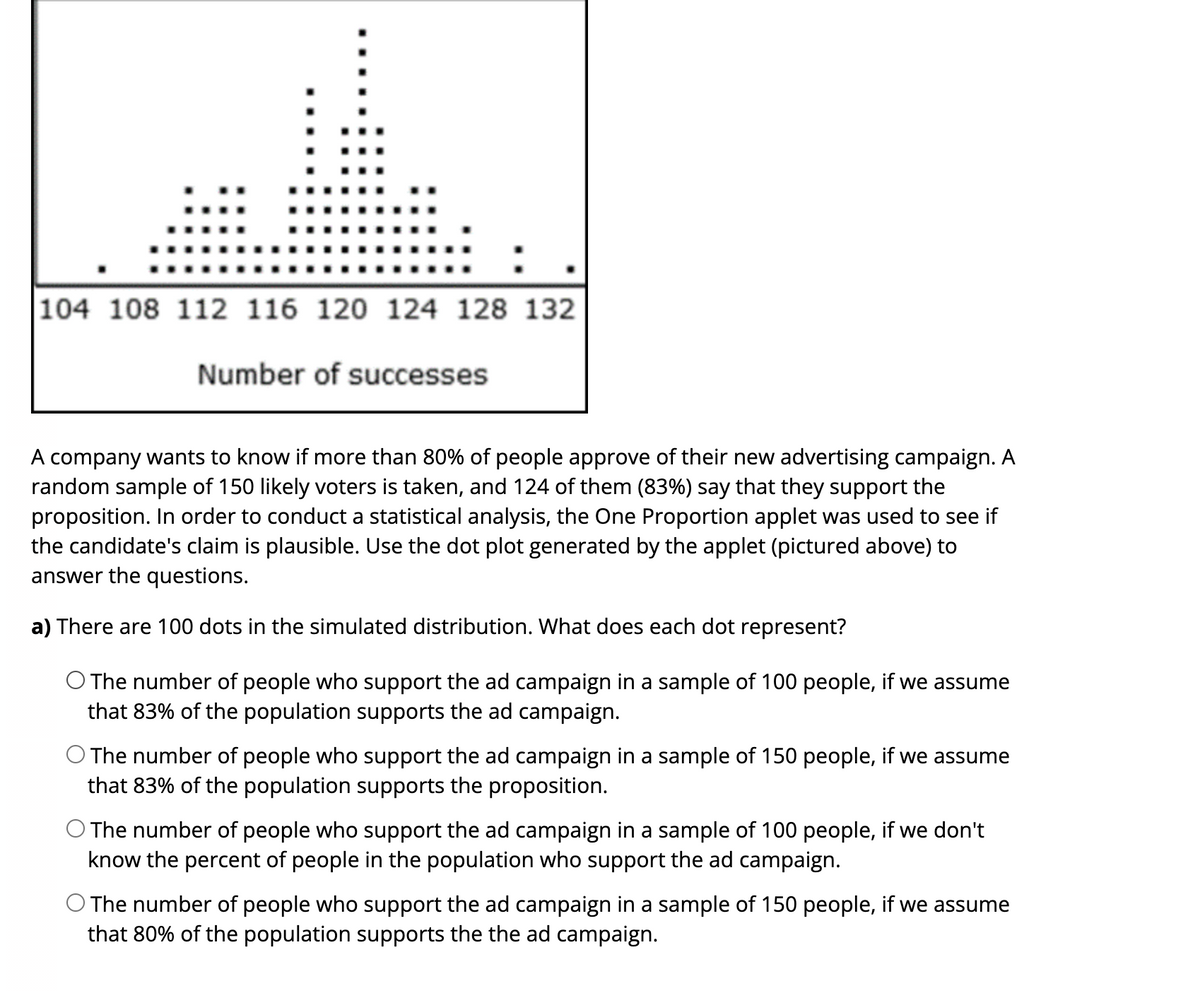
Transcribed Image Text:104 108 112 116 120 124 128 132
Number of successes
A company wants to know if more than 80% of people approve of their new advertising campaign. A
random sample of 150 likely voters is taken, and 124 of them (83%) say that they support the
proposition. In order to conduct a statistical analysis, the One Proportion applet was used to see if
the candidate's claim is plausible. Use the dot plot generated by the applet (pictured above) to
answer the questions.
a) There are 100 dots in the simulated distribution. What does each dot represent?
O The number of people who support the ad campaign in a sample of 100 people, if we assume
that 83% of the population supports the ad campaign.
The number of people who support the ad campaign in a sample of 150 people, if we assume
that 83% of the population supports the proposition.
O The number of people who support the ad campaign in a sample of 100 people, if we don't
know the percent of people in the population who support the ad campaign.
The number of people who support the ad campaign in a sample of 150 people, if we assume
that 80% of the population supports the the ad campaign.
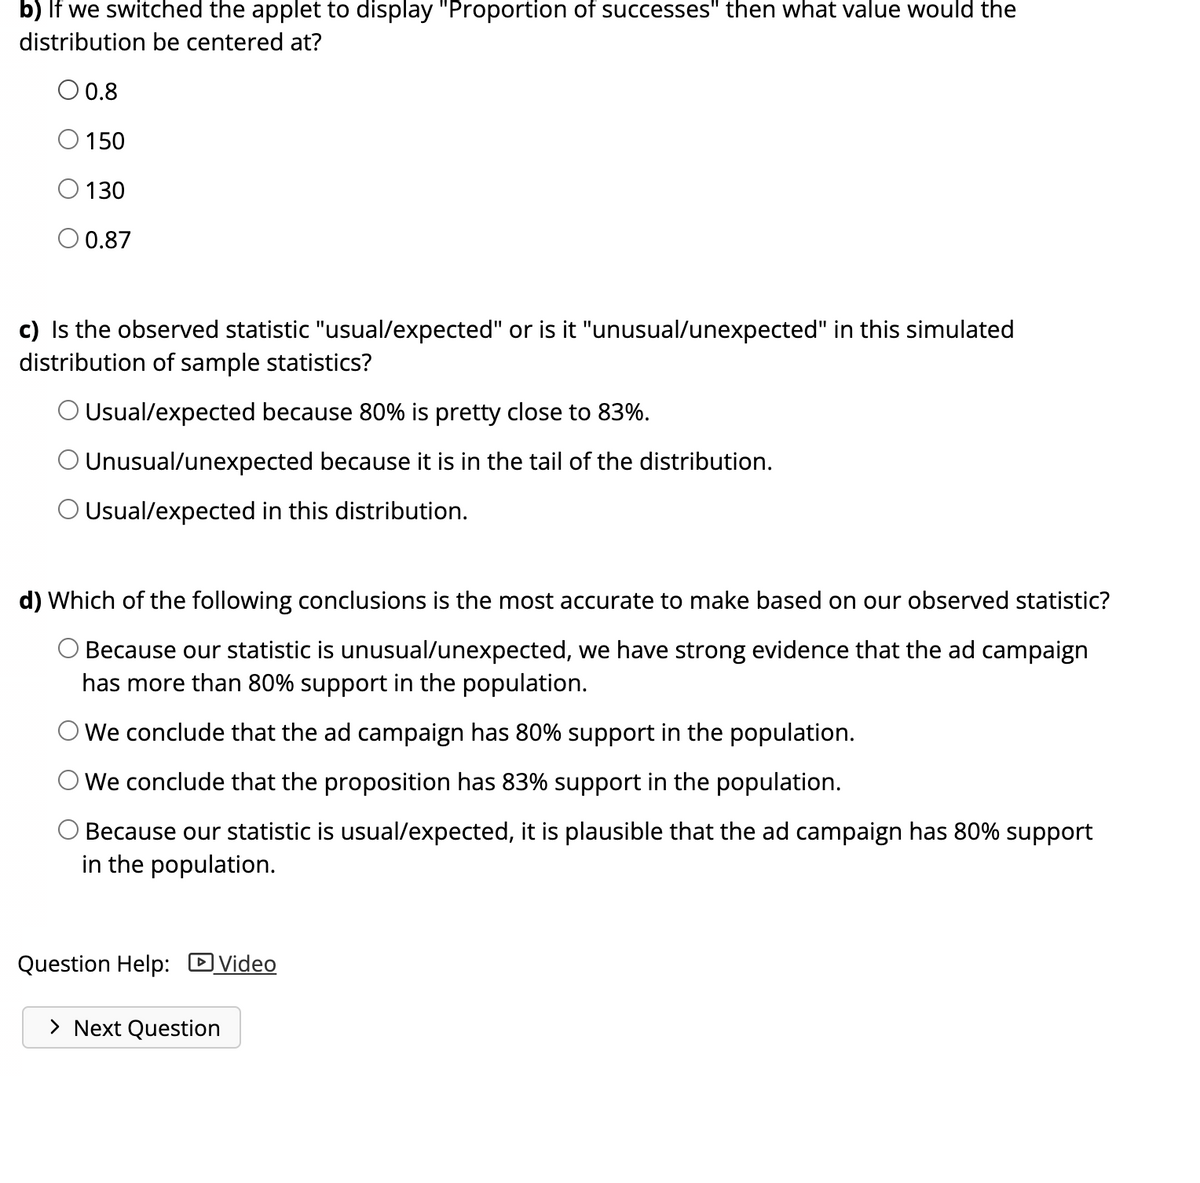
Transcribed Image Text:b) If we switched the applet to display "Proportion of successes" then what value would the
distribution be centered at?
O 0.8
150
130
O 0.87
c) Is the observed statistic "usual/expected" or is it "unusual/unexpected" in this simulated
distribution of sample statistics?
O Usual/expected because 80% is pretty close to 83%.
Unusual/unexpected because it is in the tail of the distribution.
O Usual/expected in this distribution.
d) Which of the following conclusions is the most accurate to make based on our observed statistic?
Because our statistic is unusual/unexpected, we have strong evidence that the ad campaign
has more than 80% support in the population.
O We conclude that the ad campaign has 80% support in the population.
We conclude that the proposition has 83% support in the population.
Because our statistic is usual/expected, it is plausible that the ad campaign has 80% support
in the population.
Question Help: Video
> Next Question
Expert Solution
This question has been solved!
Explore an expertly crafted, step-by-step solution for a thorough understanding of key concepts.

This is a popular solution!

Trending now
This is a popular solution!

Step by step
Solved in 2 steps

Recommended textbooks for you
Glencoe Algebra 1, Student Edition, 9780079039897…
Algebra
ISBN:
9780079039897
Author:
Carter
Publisher:
McGraw Hill

Holt Mcdougal Larson Pre-algebra: Student Edition…
Algebra
ISBN:
9780547587776
Author:
HOLT MCDOUGAL
Publisher:
HOLT MCDOUGAL
Glencoe Algebra 1, Student Edition, 9780079039897…
Algebra
ISBN:
9780079039897
Author:
Carter
Publisher:
McGraw Hill
Holt Mcdougal Larson Pre-algebra: Student Edition…
Algebra
ISBN:
9780547587776
Author:
HOLT MCDOUGAL
Publisher:
HOLT MCDOUGAL