A comparison between species: Biologists comparing the gestation period of two newly discovered species of frog collected data from 13 frogs of species A and 23 frogs of species B. Species A exhibited an average gestation period of 10 days with a standard deviation of 3.6 days while species B had a gestation period of 16 days and a standard deviation of 4 days. The researchers want to know whether the average lengths of the gestational periods differ between the two species. Conduct a hypothesis test at a significance level of a = 0.01. a) The hypotheses for this test are: Ho: HA - HB = 0 Ha: HA - HB > 0 Ho: HA - HB = 0 Ha: HA - HB < 0 Но: Ив 3D 10 На: Ив 10 Họ: HA - HB = 0 Ha: HA - HB = 0 What is the test statistic for this test? test statistic (Report answer accurate to 2 decimal places.) What is the p-value for this test? p-value = (Report answer accurate to 4 decimal places.)
A comparison between species: Biologists comparing the gestation period of two newly discovered species of frog collected data from 13 frogs of species A and 23 frogs of species B. Species A exhibited an average gestation period of 10 days with a standard deviation of 3.6 days while species B had a gestation period of 16 days and a standard deviation of 4 days. The researchers want to know whether the average lengths of the gestational periods differ between the two species. Conduct a hypothesis test at a significance level of a = 0.01. a) The hypotheses for this test are: Ho: HA - HB = 0 Ha: HA - HB > 0 Ho: HA - HB = 0 Ha: HA - HB < 0 Но: Ив 3D 10 На: Ив 10 Họ: HA - HB = 0 Ha: HA - HB = 0 What is the test statistic for this test? test statistic (Report answer accurate to 2 decimal places.) What is the p-value for this test? p-value = (Report answer accurate to 4 decimal places.)

Glencoe Algebra 1, Student Edition, 9780079039897, 0079039898, 2018
18th Edition
ISBN:9780079039897
Author:Carter
Publisher:Carter
Chapter10: Statistics
Section10.3: Measures Of Spread
Problem 26PFA

Related questions
Topic Video
Question
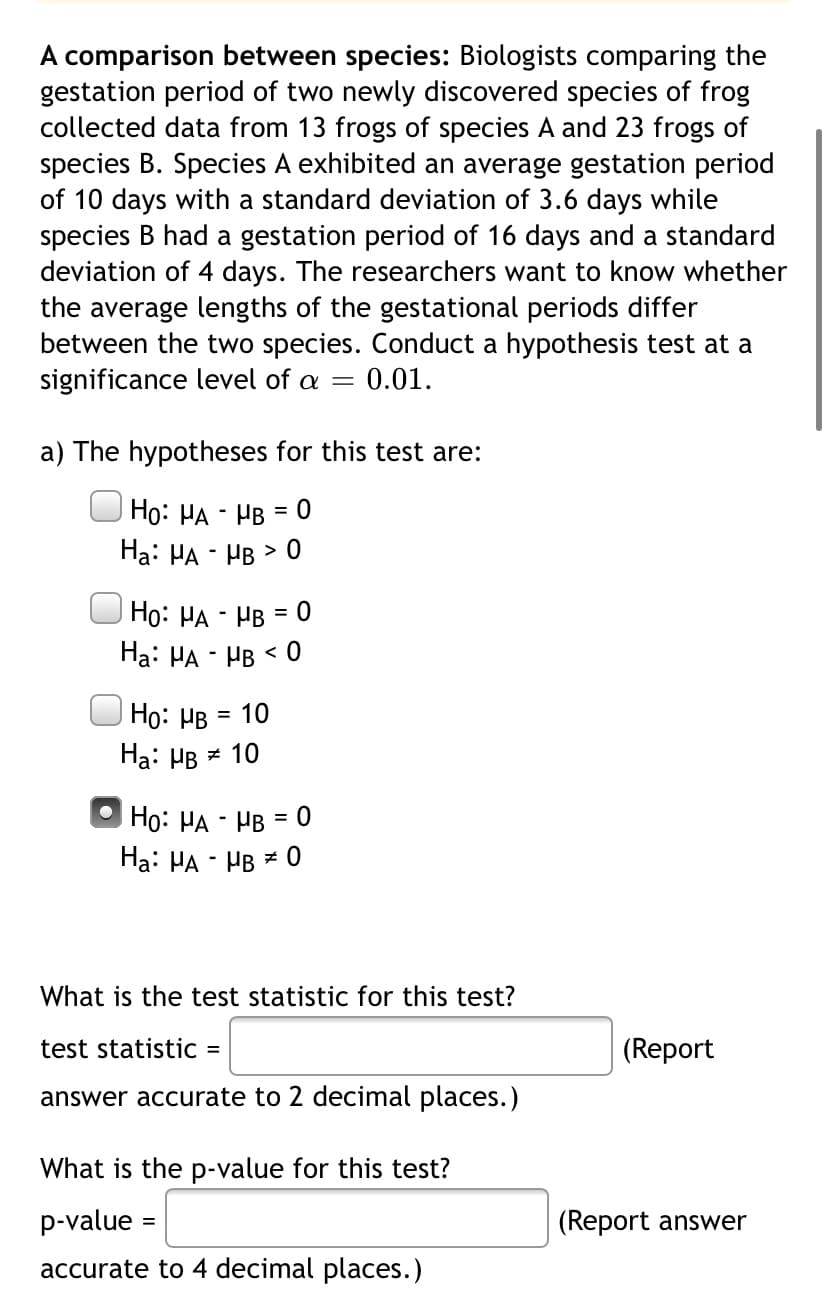
Transcribed Image Text:A comparison between species: Biologists comparing the
gestation period of two newly discovered species of frog
collected data from 13 frogs of species A and 23 frogs of
species B. Species A exhibited an average gestation period
of 10 days with a standard deviation of 3.6 days while
species B had a gestation period of 16 days and a standard
deviation of 4 days. The researchers want to know whether
the average lengths of the gestational periods differ
between the two species. Conduct a hypothesis test at a
significance level of a =
0.01.
a) The hypotheses for this test are:
Ho: HA - HB = 0
Ha: HA - HB > 0
Ho: HA - HB = 0
Ha: HA - HB < 0
Но: Ив 3D 10
На: Ив 10
Họ: HA - HB = 0
Ha: HA - HB = 0
What is the test statistic for this test?
test statistic
(Report
answer accurate to 2 decimal places.)
What is the p-value for this test?
p-value =
(Report answer
accurate to 4 decimal places.)
Expert Solution
This question has been solved!
Explore an expertly crafted, step-by-step solution for a thorough understanding of key concepts.

This is a popular solution!

Trending now
This is a popular solution!

Step by step
Solved in 4 steps with 8 images

Knowledge Booster


Learn more about
Need a deep-dive on the concept behind this application? Look no further. Learn more about this topic, statistics and related others by exploring similar questions and additional content below.Recommended textbooks for you
Glencoe Algebra 1, Student Edition, 9780079039897…
Algebra
ISBN:
9780079039897
Author:
Carter
Publisher:
McGraw Hill
Glencoe Algebra 1, Student Edition, 9780079039897…
Algebra
ISBN:
9780079039897
Author:
Carter
Publisher:
McGraw Hill