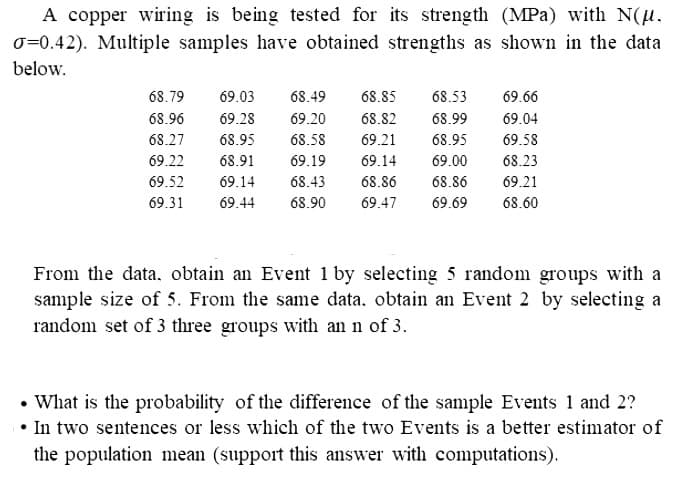
A copper wiring is being tested for its strength (MPa) with N(μ. O=0.42). Multiple samples have obtained strengths as shown in the data below. 68.79 69.03 68.49 68.85 68.53 69.66 68.96 69.28 69.20 68.82 68.99 69.04 68.27 68.95 68.58 69.21 68.95 69.58 69.22 69.19 69.14 69.00 68.23 68.91 69.52 69.14 68.43 68.86 68.86 69.44 68.90 69.47 69.69 69.31 69.21 68.60 From the data, obtain an Event 1 by selecting 5 random groups with a sample size of 5. From the same data, obtain an Event 2 by selecting a
A copper wiring is being tested for its strength (MPa) with N(μ. O=0.42). Multiple samples have obtained strengths as shown in the data below. 68.79 69.03 68.49 68.85 68.53 69.66 68.96 69.28 69.20 68.82 68.99 69.04 68.27 68.95 68.58 69.21 68.95 69.58 69.22 69.19 69.14 69.00 68.23 68.91 69.52 69.14 68.43 68.86 68.86 69.44 68.90 69.47 69.69 69.31 69.21 68.60 From the data, obtain an Event 1 by selecting 5 random groups with a sample size of 5. From the same data, obtain an Event 2 by selecting a

A First Course in Probability (10th Edition)
10th Edition
ISBN:9780134753119
Author:Sheldon Ross
Publisher:Sheldon Ross
Chapter1: Combinatorial Analysis
Section: Chapter Questions
Problem 1.1P: a. How many different 7-place license plates are possible if the first 2 places are for letters and...

Related questions
Question
Transcribed Image Text:A copper wiring is being tested for its strength (MPa) with N(μ.
O=0.42). Multiple samples have obtained strengths as shown in the data
below.
68.79
68.96
68.27
69.22
69.52
69.31
69.03 68.49 68.85 68.53
69.28
69.20
68.82
68.99
68.95
68.58
69.21
68.95
68.91
69.19 69.14 69.00
69.14
68.43
68.86
68.86
69.44
68.90 69.47 69.69
69.66
69.04
69.58
68.23
69.21
68.60
From the data, obtain an Event 1 by selecting 5 random groups with a
sample size of 5. From the same data. obtain an Event 2 by selecting a
random set of 3 three groups with an n of 3.
• What is the probability of the difference of the sample Events 1 and 2?
• In two sentences or less which of the two Events is a better estimator of
the population mean (support this answer with computations).
Expert Solution
This question has been solved!
Explore an expertly crafted, step-by-step solution for a thorough understanding of key concepts.

Step by step
Solved in 4 steps with 5 images

Recommended textbooks for you
A First Course in Probability (10th Edition)
Probability
ISBN:
9780134753119
Author:
Sheldon Ross
Publisher:
PEARSON

A First Course in Probability (10th Edition)
Probability
ISBN:
9780134753119
Author:
Sheldon Ross
Publisher:
PEARSON