-A Department of Mathematics at a University claims in an advertisement that the mean math SAT scores of its majors is at least 600. Admissions at the University wants to make sure that the statement of the Department of Mathematics is a reasonable one and decides to test the claim using a significance level of 0.10 with a random sample of 16 math majors. The results are below. SAT scores are normally distributed with a population standard deviation of 15. 570 610 620 560 630 610 570 610 550 560 580 620 600 600 580 650
-A Department of Mathematics at a University claims in an advertisement that the mean math SAT scores of its majors is at least 600. Admissions at the University wants to make sure that the statement of the Department of Mathematics is a reasonable one and decides to test the claim using a significance level of 0.10 with a random sample of 16 math majors. The results are below. SAT scores are normally distributed with a population standard deviation of 15. 570 610 620 560 630 610 570 610 550 560 580 620 600 600 580 650

Glencoe Algebra 1, Student Edition, 9780079039897, 0079039898, 2018
18th Edition
ISBN:9780079039897
Author:Carter
Publisher:Carter
Chapter10: Statistics
Section10.4: Distributions Of Data
Problem 19PFA

Related questions
Question
a) p-value
b) reject or fail to reject?
c) state conclusion in words
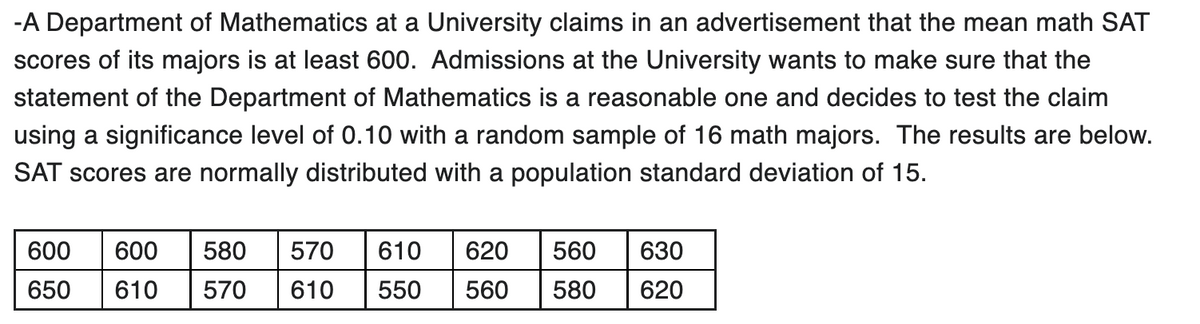
Transcribed Image Text:-A Department of Mathematics at a University claims in an advertisement that the mean math SAT
scores of its majors is at least 600. Admissions at the University wants to make sure that the
statement of the Department of Mathematics is a reasonable one and decides to test the claim
using a significance level of 0.10 with a random sample of 16 math majors. The results are below.
SAT scores are normally distributed with a population standard deviation of 15.
600 600 580 570 610 620
650 610 570 610 550 560 580
560 630
620
Expert Solution
This question has been solved!
Explore an expertly crafted, step-by-step solution for a thorough understanding of key concepts.

Step by step
Solved in 5 steps with 1 images

Recommended textbooks for you
Glencoe Algebra 1, Student Edition, 9780079039897…
Algebra
ISBN:
9780079039897
Author:
Carter
Publisher:
McGraw Hill
Glencoe Algebra 1, Student Edition, 9780079039897…
Algebra
ISBN:
9780079039897
Author:
Carter
Publisher:
McGraw Hill