(a) Determine a point estimate for the population mean. A point estimate for the population mean is. (Round to two decimal places as needed.)
(a) Determine a point estimate for the population mean. A point estimate for the population mean is. (Round to two decimal places as needed.)
Chapter9: Sequences, Probability And Counting Theory
Section9.7: Probability
Problem 5SE: The union of two sets is defined as a set of elements that are present in at least one of the sets....
Related questions
Question

Transcribed Image Text:Ле
right tail
Degrees of
Freedom 0.25 0.20 0.15 0.10
Degrees of
0.25 0.20
0.15
1-Distribution
Area in Right
तततततत dddवत तंतततत ततततत
NNNNNİ SİNİNİNİNİ SİNİNİNİN
=====EEEEE
1-Distribution
Area in Right Tail
INNN NNicicici cicNNN NNNNN NNN NNNNN
eieieiciei eiciciele Ned
NN NNNNNNNNNNNNNNNNNNNNNNN
ERERAR JA882 2222
NİGİNİNciei cieieieiei eiciei
0.01 0.005 0.0025
0.001 0.0005

Transcribed Image Text:The following data represent the pH of rain for a random sample of 12 rain dates. A normal probability plot suggests the data could come
from a population that is normally distributed. A boxplot indicates there are no outliers. Complete parts a) through d) below.
Click the icon to view the table of critical t-values.
Table of Critical t-Values
(a) Determine a point estimate for the population mean.
A point estimate for the population mean is
(Round to two decimal places as needed.)
5.05
5.02
5.43
5.72
4.59
4.76
4.99
4.74
4.56
4.80
5.19
5.68
0
Expert Solution
This question has been solved!
Explore an expertly crafted, step-by-step solution for a thorough understanding of key concepts.
This is a popular solution!
Trending now
This is a popular solution!
Step by step
Solved in 3 steps with 2 images

Follow-up Questions
Read through expert solutions to related follow-up questions below.
Follow-up Question

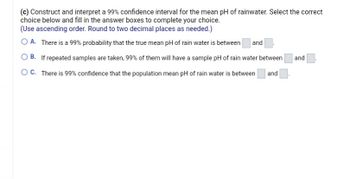
Transcribed Image Text:(c) Construct and interpret a 99% confidence interval for the mean pH of rainwater. Select the correct
choice below and fill in the answer boxes to complete your choice.
(Use ascending order. Round to two decimal places as needed.)
O A. There is a 99% probability that the true mean pH of rain water is between and
OB. If repeated samples are taken, 99% of them will have a sample pH of rain water between and
and
O C. There is 99% confidence that the population mean pH of rain water is between
Solution
Follow-up Question

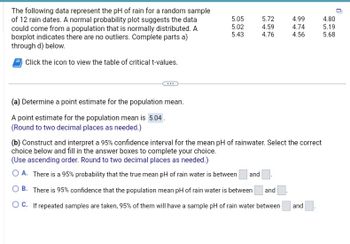
Transcribed Image Text:The following data represent the pH of rain for a random sample
of 12 rain dates. A normal probability plot suggests the data
could come from a population that is normally distributed. A
boxplot indicates there are no outliers. Complete parts a)
through d) below.
Click the icon to view the table of critical t-values.
(a) Determine a point estimate for the population mean.
A point estimate for the population mean is 5.04.
(Round to two decimal places as needed.)
5.05
5.02
5.43
5.72
4.59
4.76
4.99
4.74
4.56
(b) Construct and interpret a 95% confidence interval for the mean pH of rainwater. Select the correct
choice below and fill in the answer boxes to complete your choice.
(Use ascending order. Round to two decimal places as needed.)
O A. There is a 95% probability that the true mean pH of rain water is between and
OB. There is 95% confidence that the population mean pH of rain water is between and
OC. If repeated samples are taken, 95% of them will have a sample pH of rain water between
and
4.80
5.19
5.68
Solution
Recommended textbooks for you


Calculus For The Life Sciences
Calculus
ISBN:
9780321964038
Author:
GREENWELL, Raymond N., RITCHEY, Nathan P., Lial, Margaret L.
Publisher:
Pearson Addison Wesley,


Calculus For The Life Sciences
Calculus
ISBN:
9780321964038
Author:
GREENWELL, Raymond N., RITCHEY, Nathan P., Lial, Margaret L.
Publisher:
Pearson Addison Wesley,