a) Determine the 3-sigma x -chart control limits Upper Control Limit (UCL- ) = ____ units (round your response to two decimal places). Lower Control Limit (LCL- ) = _____ units (round your response to two decimal places). B) Determine the 2-sigma x-chart control limits Upper Control Limit (UCL-) = units (round your response to two decimal places). units (round your response to two decimal places). Lower Control Limit (LCL-) = How do the control limits change? A-The control limits for the 2-sigma overbar x-chart and for the 3-sigma x -chart are the same B- The control limits are tighter for the 2-sigma overbar x -chart than for the 3-sigma x -chart. C- The control limits are tighter for the 3-sigma overbar x -chart than for the 2-sigma x -chart.
a) Determine the 3-sigma x -chart control limits Upper Control Limit (UCL- ) = ____ units (round your response to two decimal places). Lower Control Limit (LCL- ) = _____ units (round your response to two decimal places). B) Determine the 2-sigma x-chart control limits Upper Control Limit (UCL-) = units (round your response to two decimal places). units (round your response to two decimal places). Lower Control Limit (LCL-) = How do the control limits change? A-The control limits for the 2-sigma overbar x-chart and for the 3-sigma x -chart are the same B- The control limits are tighter for the 2-sigma overbar x -chart than for the 3-sigma x -chart. C- The control limits are tighter for the 3-sigma overbar x -chart than for the 2-sigma x -chart.

Glencoe Algebra 1, Student Edition, 9780079039897, 0079039898, 2018
18th Edition
ISBN:9780079039897
Author:Carter
Publisher:Carter
Chapter4: Equations Of Linear Functions
Section: Chapter Questions
Problem 8SGR

Related questions
Question
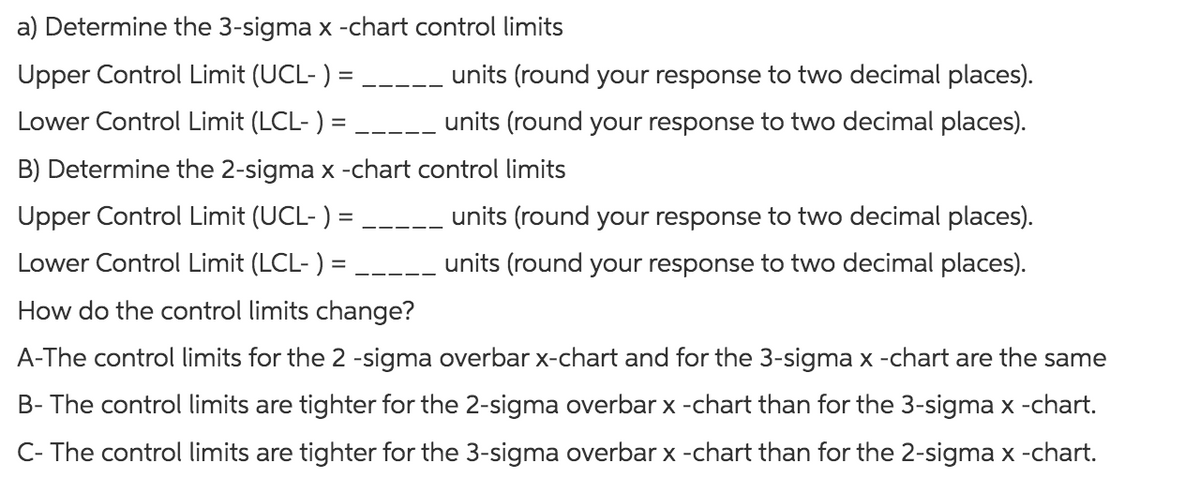
Transcribed Image Text:a) Determine the 3-sigma x -chart control limits
units (round your response to two decimal places).
units (round your response to two decimal places).
—————
Upper Control Limit (UCL-) =
Lower Control Limit (LCL-) =
B) Determine the 2-sigma x -chart control limits
Upper Control Limit (UCL-) =
units (round your response to two decimal places).
units (round your response to two decimal places).
Lower Control Limit (LCL- ) =
How do the control limits change?
A-The control limits for the 2 -sigma overbar x-chart and for the 3-sigma x -chart are the same
B- The control limits are tighter for the 2-sigma overbar x -chart than for the 3-sigma x -chart.
C- The control limits are tighter for the 3-sigma overbar x -chart than for the 2-sigma x -chart.

Transcribed Image Text:The overall average on a process you are attempting to monitor is 50.0 units. The process population standard
deviation is 1.84. Sample size is given to be 16.
Expert Solution
This question has been solved!
Explore an expertly crafted, step-by-step solution for a thorough understanding of key concepts.

This is a popular solution!

Trending now
This is a popular solution!

Step by step
Solved in 2 steps

Recommended textbooks for you
Glencoe Algebra 1, Student Edition, 9780079039897…
Algebra
ISBN:
9780079039897
Author:
Carter
Publisher:
McGraw Hill
Glencoe Algebra 1, Student Edition, 9780079039897…
Algebra
ISBN:
9780079039897
Author:
Carter
Publisher:
McGraw Hill