(a) Draw a scatter diagram of the data Choose the correct graph below. Data set OC. 4 6. 4. 10 13 19 10 (b) By hand, compute the correlation coefficient Print Done The correlation coefficient is r (Round to three decimal places as needed.)
(a) Draw a scatter diagram of the data Choose the correct graph below. Data set OC. 4 6. 4. 10 13 19 10 (b) By hand, compute the correlation coefficient Print Done The correlation coefficient is r (Round to three decimal places as needed.)

Glencoe Algebra 1, Student Edition, 9780079039897, 0079039898, 2018
18th Edition
ISBN:9780079039897
Author:Carter
Publisher:Carter
Chapter4: Equations Of Linear Functions
Section4.5: Correlation And Causation
Problem 11PPS

Related questions
Question
What’s the correlation coefficient
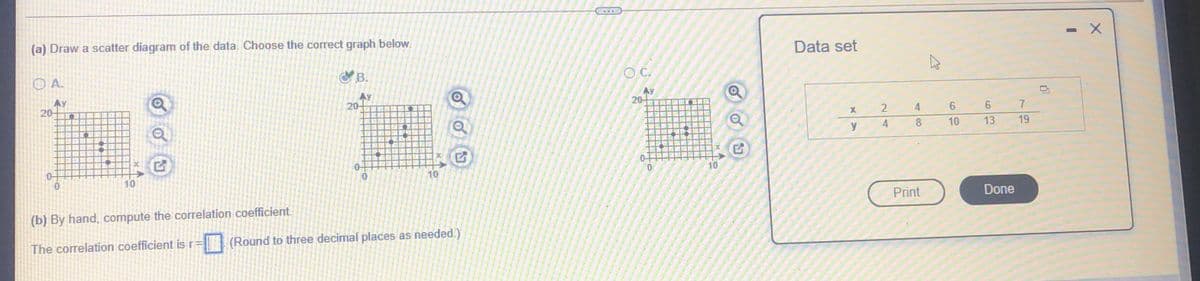
Transcribed Image Text:(a) Draw a scatter diagram of the data. Choose the correct graph below.
Data set
OC.
B.
O A.
Ay
20-
AY
20-
Ay
20-
4
7
4
8.
10
13
19
0-
0.
10
10
10
Print
Done
(b) By hand, compute the correlation coefficient.
(Round to three decimal places as needed.)
The correlation coefficient is r=
4 00
Expert Solution
This question has been solved!
Explore an expertly crafted, step-by-step solution for a thorough understanding of key concepts.

Step by step
Solved in 2 steps with 3 images

Recommended textbooks for you
Glencoe Algebra 1, Student Edition, 9780079039897…
Algebra
ISBN:
9780079039897
Author:
Carter
Publisher:
McGraw Hill
Glencoe Algebra 1, Student Edition, 9780079039897…
Algebra
ISBN:
9780079039897
Author:
Carter
Publisher:
McGraw Hill