A drug trial had 683 participants. A survey was taken to determine how many had nausea as a side effect, how many had dizziness, and how many had fatigue. The Venn diagram below shows the results. (Each number gives the number of participants who fall into that Venn diagram category.) CAll participants in the survey- (a) How many of the participants had nausea? Had- nausea Had dizziness participants 125 52 121 (b) How many of the participants had neither nausea nor fatigue? 64 39 124 participants 81 (c) How many of the participants had both dizziness and fatigue, but didn't have nausea? 77 participants Had- fatigue
A drug trial had 683 participants. A survey was taken to determine how many had nausea as a side effect, how many had dizziness, and how many had fatigue. The Venn diagram below shows the results. (Each number gives the number of participants who fall into that Venn diagram category.) CAll participants in the survey- (a) How many of the participants had nausea? Had- nausea Had dizziness participants 125 52 121 (b) How many of the participants had neither nausea nor fatigue? 64 39 124 participants 81 (c) How many of the participants had both dizziness and fatigue, but didn't have nausea? 77 participants Had- fatigue

Algebra and Trigonometry (MindTap Course List)
4th Edition
ISBN:9781305071742
Author:James Stewart, Lothar Redlin, Saleem Watson
Publisher:James Stewart, Lothar Redlin, Saleem Watson
Chapter14: Counting And Probability
Section14.1: Counting
Problem 84E

Related questions
Question
Transcribed Image Text:Interpreting Venn diagram cardinalities with 3 sets for a real-..
Kol
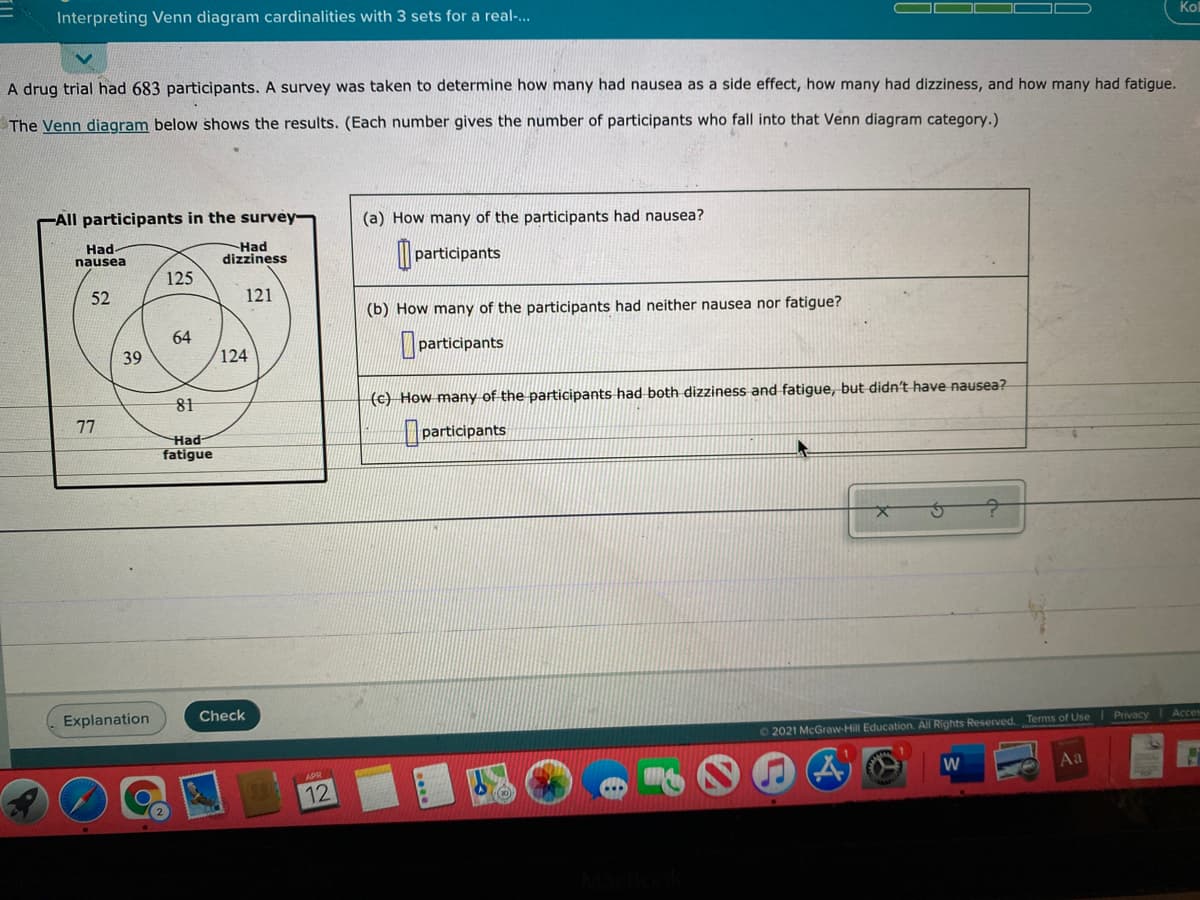
A drug trial had 683 participants. A survey was taken to determine how many had nausea as a side effect, how many had dizziness, and how many had fatigue.
The Venn diagram below shows the results. (Each number gives the number of participants who fall into that Venn diagram category.)
All participants in the survey-
(a) How many of the participants had nausea?
Had
nausea
Had
dizziness
I participants
125
52
121
(b) How many of the participants had neither nausea nor fatigue?
64
39
124
participants
81
(c) How many of the participants had both dizziness and fatigue, but didn't have nausea?
77
Had-
fatigue
|participants
Explanation
Check
Privacy
Acces
O 2021 McGraw-Hill Education. All Rights Reserved. Terms of Use
Aa
APR
12
...
Expert Solution
This question has been solved!
Explore an expertly crafted, step-by-step solution for a thorough understanding of key concepts.

This is a popular solution!

Trending now
This is a popular solution!

Step by step
Solved in 2 steps with 2 images

Knowledge Booster


Learn more about
Need a deep-dive on the concept behind this application? Look no further. Learn more about this topic, algebra and related others by exploring similar questions and additional content below.Recommended textbooks for you
Algebra and Trigonometry (MindTap Course List)
Algebra
ISBN:
9781305071742
Author:
James Stewart, Lothar Redlin, Saleem Watson
Publisher:
Cengage Learning

College Algebra
Algebra
ISBN:
9781305115545
Author:
James Stewart, Lothar Redlin, Saleem Watson
Publisher:
Cengage Learning

College Algebra (MindTap Course List)
Algebra
ISBN:
9781305652231
Author:
R. David Gustafson, Jeff Hughes
Publisher:
Cengage Learning
Algebra and Trigonometry (MindTap Course List)
Algebra
ISBN:
9781305071742
Author:
James Stewart, Lothar Redlin, Saleem Watson
Publisher:
Cengage Learning
College Algebra
Algebra
ISBN:
9781305115545
Author:
James Stewart, Lothar Redlin, Saleem Watson
Publisher:
Cengage Learning
College Algebra (MindTap Course List)
Algebra
ISBN:
9781305652231
Author:
R. David Gustafson, Jeff Hughes
Publisher:
Cengage Learning