A firm's production function is given as Q = 2 (min(3K, 2L)]i. And the price of the output is given as P $240 per unit. Also suppose that the price of input K, r, is $6 per unit, and the price of input L, w, is $4 per worker. (Note that we did not assume this firm in a competitive market. So it may have some positive profits even in the long run). (from Midterm 2012) %3D (a) Draw isoquant curves. What is the relationship of the two inputs of K and L? (b) Suppose that the firm is given an order of producing Q = 60 units. What are the optimal levels of K and L? (c) In the long run, what is the optimal level of production? (Assume that there is no change in prices) What is the size of its profit?
A firm's production function is given as Q = 2 (min(3K, 2L)]i. And the price of the output is given as P $240 per unit. Also suppose that the price of input K, r, is $6 per unit, and the price of input L, w, is $4 per worker. (Note that we did not assume this firm in a competitive market. So it may have some positive profits even in the long run). (from Midterm 2012) %3D (a) Draw isoquant curves. What is the relationship of the two inputs of K and L? (b) Suppose that the firm is given an order of producing Q = 60 units. What are the optimal levels of K and L? (c) In the long run, what is the optimal level of production? (Assume that there is no change in prices) What is the size of its profit?

Algebra for College Students
10th Edition
ISBN:9781285195780
Author:Jerome E. Kaufmann, Karen L. Schwitters
Publisher:Jerome E. Kaufmann, Karen L. Schwitters
Chapter12: Algebra Of Matrices
Section12.CR: Review Problem Set
Problem 37CR

Related questions

Concept explainers
Contingency Table
A contingency table can be defined as the visual representation of the relationship between two or more categorical variables that can be evaluated and registered. It is a categorical version of the scatterplot, which is used to investigate the linear relationship between two variables. A contingency table is indeed a type of frequency distribution table that displays two variables at the same time.
Binomial Distribution
Binomial is an algebraic expression of the sum or the difference of two terms. Before knowing about binomial distribution, we must know about the binomial theorem.
Topic Video
Question
Answer all
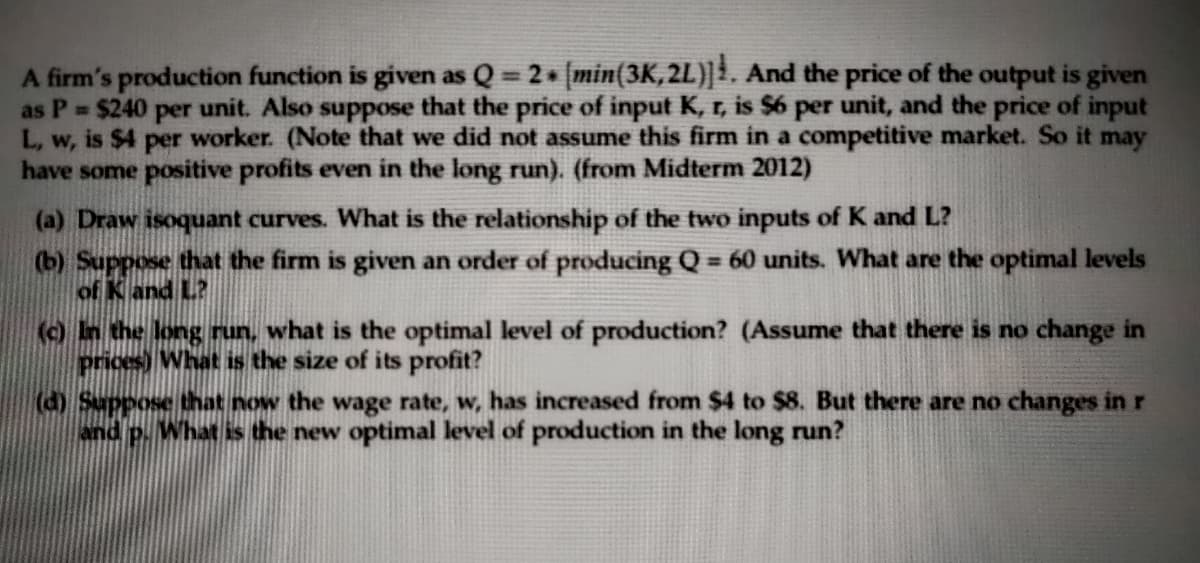
Transcribed Image Text:A firm's production function is given as Q 2 min(3K, 2L)|1. And the price of the output is given
as P $240 per unit. Also suppose that the price of input K, r, is $6 per unit, and the price of input
L, w, is $4 per worker. (Note that we did not assume this firm in a competitive market. So it may
have some positive profits even in the long run). (from Midterm 2012)
(a) Draw isoquant curves. What is the relationship of the two inputs of K and L?
(b) Suppose that the firm is given an order of producing Q = 60 units. What are the optimal levels
of K and L?
() In the long run, what is the optimal level of production? (Assume that there is no change in
prices) What is the size of its profit?
(d) Suppose that now the wage rate, w, has increased from $4 to $8. But there are no changes in r
P. What is the new optimal level of production in the long run?
Expert Solution
This question has been solved!
Explore an expertly crafted, step-by-step solution for a thorough understanding of key concepts.

Step by step
Solved in 3 steps with 1 images

Knowledge Booster


Learn more about
Need a deep-dive on the concept behind this application? Look no further. Learn more about this topic, advanced-math and related others by exploring similar questions and additional content below.Recommended textbooks for you
Algebra for College Students
Algebra
ISBN:
9781285195780
Author:
Jerome E. Kaufmann, Karen L. Schwitters
Publisher:
Cengage Learning

Algebra: Structure And Method, Book 1
Algebra
ISBN:
9780395977224
Author:
Richard G. Brown, Mary P. Dolciani, Robert H. Sorgenfrey, William L. Cole
Publisher:
McDougal Littell
Algebra for College Students
Algebra
ISBN:
9781285195780
Author:
Jerome E. Kaufmann, Karen L. Schwitters
Publisher:
Cengage Learning
Algebra: Structure And Method, Book 1
Algebra
ISBN:
9780395977224
Author:
Richard G. Brown, Mary P. Dolciani, Robert H. Sorgenfrey, William L. Cole
Publisher:
McDougal Littell