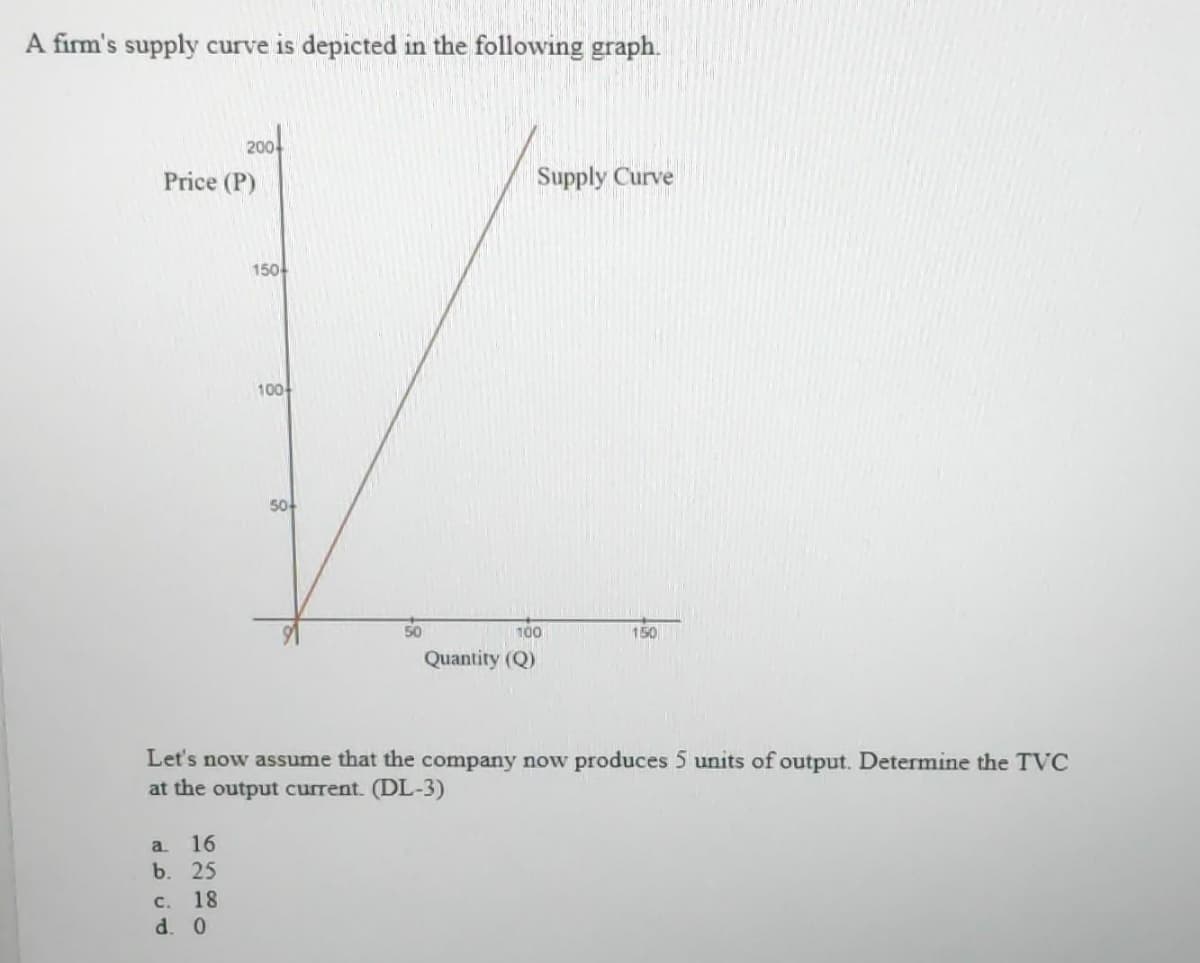
A firm's supply curve is depicted in the following graph. 2004 Price (P) a. 16 b. 25 c. 18 d. 0 150 100+ 50+ 50 Supply Curve 100 Quantity (Q) 150 Let's now assume that the company now produces 5 units of output. Determine the TVC at the output current. (DL-3)


Q: The following mutually exclusive investment alternatives have been presented to you. The life of all…
A: It is given in the question that the IRR of alternative B, C, D, and E is 7.4%, 25.4%, 39%, and 9.2%…
Q: According to the law of diminishing returns, if a factory keeps adding more workers while keeping…
A: The law of diminishing returns is an economic concept that explains the relationship between inputs…
Q: a) the equilibrium output level, b) the budget balance the trade balance c)
A: The aggregate expenditure schedule demonstrates how much an economy's total planned expenditures are…
Q: Note: Good A B C D E F G H I J Nominal rate 10% 5% 0% 30% 2% 2.5% 15% R0.50/unit 40% R2.50/unit…
A: We need to take the average of all the nominal tariff rates without considering the import values.…
Q: The following are key characteristics of Bitcoins as one of the main cryptocurrencies currently in…
A: Bitcoins are one of the main cryptocurrencies available today, known for their unique…
Q: Tom's lawn service specializes in mowing lawns and trimming bushes. Tom has 4 hours to devote to…
A: The value of alternative opportunities foregone and sacrificed to acquire one unit of a commodity is…
Q: E.g.1: A demand function is given by the equation P = 24 – 6lnQ - Find the equation of TR (total…
A: TR (total revenue)= P (price) *Q (quantity)MR (marginal revenue) dTR/dQTR is maximum at Q where…
Q: Maya divides her income between coffee and croissants (both of which are normal goods).…
A: A budget constraint is a concept in economics that describe the limitations or restrictions on the…
Q: Use the data related to cyclical vs. structural budget balances (in billions of dollars) to answer…
A: The federal spending plan is significant because it explains the government's revenues and expenses,…
Q: The Camera Shop sells two popular models of digital SLR cameras. The sales of these products are not…
A: - Optimality of Revenue:Optimality refers to the state or condition of being the best or most…
Q: Q4) What is price discrimination. What are its types and how it affects production and prices?
A: Price discrimination means the practice of charging different prices for the same product or service…
Q: The following graph illustrates a labour market. If the market wage rate is currently $5 per hour,…
A: The labor market refers to the marketplace where individuals supply their labor and employers demand…
Q: What administrative trade policies are in place in Australia that make it difficult for imports to…
A: Here is an overview of some administrative trade rules that were in Australia:-
Q: 5 Looking table, which gives the unit labour requirement USA Germany Amrah 12 50
A: When two nations are compared and one of the nations has a lower OC in producing a service or…
Q: Charlie has $12,000 to invest for a period of 5 years. The following three alternatives are…
A: Given Initial amount =$12000The time period of investment =5 years To find the best alternative we…
Q: Based on Figure 1, choose the correct statement. Assume that Nation 2 a small country and imposes a…
A: When the price is increased from $1 to $2 and the total quantity is decreased from 70 to 50 units,…
Q: “I’m working as a restaurant consultant. My clients are Amy’s Diner and Joe’s Burger Stop. Both…
A: Market demand for a commodity can change as a result of a change in consumers income, their tastes…
Q: Year (Dollars) (Quarts) 2020 1 200 2021 1 2022 2 Year 2020 2021 2022 400 400 The following table…
A: Growth of a variable between year 't' and 't+1'= [Value of the variable (at year 't+1') - Value of…
Q: 11. Recession True or False: The aggregate-demand curve slopes downward because it is the horizontal…
A: Aggregate Demand: The aggregate demand is a sum of private investment demand, government…
Q: NAME THE FOOD MENU THAT FOUND IN CASUAL AND FINE DINE RESTAURANT SCRAMBLE WORDS 1. KCINHNEC GESTGUN…
A: Hello and welcome to our fun food menu scramble game! In this challenge, we have scrambled the names…
Q: (a) Find the down payment. The down payment is $.
A: Here, given that the building sells for $275,000 and a 4% down payment is made.Then, we have to find…
Q: Let CD= $1200 b, c = 0.95, r = 10% and TR = $130b. Calculate Cu, RR, ER, e, B, m, and M₁.
A: To calculate the various metrics and values, let's use the following definitions:CD = Currency in…
Q: Show the necessary graphs to fully explain all requested effects. label graphs and give brief…
A: The question is about the Heckscher-Ohlin model, which is a general equilibrium mathematical model…
Q: Note: No referencing is required for short answer questions The following market is a duopoly…
A: Oligopoly is a form of market where there is only a limited number of firms or suppliers who have a…
Q: Bailey, Inc., is considering buying a new gang punch that would allow them to produce circuit boards…
A: Present worth is a financial concept that refers to the value today of a future stream of cash…
Q: Draw a graph that shows the labor vs leisure for US firms using undocumented immigrants.
A: The employment landscape in country U is centered on the nation's need for workers and their…
Q: 1. Consider the National Income Model: Y = C + Io + Go C = a +B(Y-T) T = y + SY a. Define and…
A: Note: Since you have asked to solve from part d. I have solved for part d. Given: The National…
Q: How would you discuss competitive advantage and how a company estimates their own competitive…
A: Economic advantage refers to the ability of an individual, company, or country to achieve superior…
Q: g) What is the optimal number of episodes of show 1 for Jeff to watch? h) What is the optimal number…
A: An indifference curve is a graphical representation of the combinations of two goods that provide…
Q: How does a company like Walmart, determine its techniques to estimate and forecast its competitive…
A: Determining techniques to estimate and forecast competitive advantage is crucial for companies like…
Q: How is peak-load pricing a form of price discrimination? Give an example.
A: Monopolistic competition is one of the various types that a market possesses. Under this structure,…
Q: Table below shows total demand and supply of loanable funds (in RM billions) in an imaginary…
A: The market that depicts the interaction between borrowers and lenders in the financial system is the…
Q: Assume that Trinbago is a small country that produces wine and motor vehicles, where motor vehicles…
A: An economic theory known as the Heckscher-Ohlin model uses variations in endowments of factors…
Q: "Animal spirits"—optimism about and predictions for the current and future state of markets—can fuel…
A: An asset price bubble refers to a scenario where the value of an asset experiences a rapid and…
Q: Calculate the elasticity of demand between these two price-quantity combination by using the…
A: Elasticity of demand refers to the degree of responsiveness of demand by comparing the percentage…
Q: The graph shows the market for education in a developing country. In this country all schools are…
A: The Externalities are side effects of economic activities that are not accounted for by the market…
Q: Suppose that the market for cab rides in a community is initially in long-run equilibrium.…
A: Market price describes the existing or current price at which a good, service, or asset is bought…
Q: The following market is a duopoly populated only by the companies Alpha and Beta. The pay-off matrix…
A: Oligopoly is a form of market where there is only a limited number of firms or suppliers who have a…
Q: Aerotron Electronics has just bought a used delivery truck for $15,000. The small business paid…
A: To calculate the nominal interest rate and effective interest rate, we can use the information…
Q: By taking into consideration the history of the Caribbean, the economic theories underpinning…
A: To construct a suitable economic model for the development of the Caribbean, we need to consider the…
Q: y spatial relationship of the countries Nepal, Jamaica, Senegal and Brazil?
A: The core-periphery spatial relationship refers to the economic and spatial interdependence between…
Q: In AD/AS analysis, fiscal policy affects the economy through: OA. Both the AS and AD curves. OB. The…
A: The economy's output is not always at the potential level in the short run causing some adverse…
Q: Question 1- The recent covid19 pandemic had shocked the global economy and investors were scrambling…
A: ***Since the students have asked multiple unrelated questions, the expert is required to solve only…
Q: 1) Application of Minimum Value Functions. Derive Suppose the following Cobb-Douglas production…
A: The Cobb-Douglas production function is a mathematical equation that represents the relationship…
Q: Using the graph, shift the short-run aggregate supply (AS) c or the aggregate demand (AD) curve to…
A: AD(aggregate demand) is the sum of C(consumption), I(investment ), G(government spending) and net…
Q: 2. Explain what will be the result of cheaper sugar used in production of cakes at Bread Talks. What…
A: Demand and supply are two factors which determine the price and quantity level at equilibrium where…
Q: How do you analyze how Publix oligopolies position themselves to be successful?
A: How do Winn-Dixie and other oligopolistic companies position themselves for success? Analyzing the…
Q: The below graph represents a monopoly market, the revenue maximizing price is $ $ 10 9 8 7 6 S 4 3 2…
A: Monopoly : A company becomes a monopoly when it is the only seller of its product and there are no…
Q: Refer to the information provided in Figure 2 below to answer the questions that follow. Price per…
A: Monopolies can turn out to be very harmful to an industry and its consumers. Monopolies may thwart…
Q: Q5) Distinguish between marginal pricing and cost-plus pricing.
A: Pricing in means the process of setting a monetary value on goods, services, or resources. It…

Step by step
Solved in 3 steps with 12 images


- The variable x represents the number of HDTVs manufactured and sold in a given month. The variable p is the price charged when you sell a TV. A demand curve is given by p = 660-3x. Assume you must pay salaries totalling 8000$ in a month. Also, it costs $110 to manufacture one TV. Graph the profit function, M(x)=550x-3x²-8000, and using the Maximum program, find the maximum possible profit and fill in the details (round off x to the nearest whole number): number of sales:1) a) Solve the following inequalities:(i) 5(11 − ?) < ? + 49 (ii) 7? − 3 <10m + 23< 8 − 5m (iii) ?2 ≥ 15 − 2? b) The cost structure for iPhones are as follows, fixed cost of $25 and variable cost perunit of $2. The associated demand function isp = 20 − q .(i) Obtain an expression for the profit, π(q). (ii) Find the range of output which gives a profit of at least $31. c) Use Microsoft Word or Excel to solve the system of linear inequalities:r + 5t ≤ 57t – 2r ≤ 4 r ≥ 0(NB: clearly identify the solution set by placing a BIG enough ‘S’ to coverthat entire region).1. A firm is said to be earning normal profit whenever:A. Accounting profit is zero.B. Economic profit is positive.C. Accounting profit is positive.D. Total revenue equals explicit and implicit costs.2. If a 10% increase in inputs results in a 20% increase in output, then the firm is said to exhibit:A. Diseconomies of scaleB. Diminishing marginal returns to scaleC. Constant returns to scaleD. Economies of scale3. Economists have traditionally attempted to avoid the trap of:A. Thinking in terms of total utility.B. Computing marginal utilityC. Making interpersonal utility comparisons.D. None of the above.4. According to the water-diamond paradoxA. Water has a lower MU than Diamond.B. Water has a higher TU than Diamond.C. Prices reflect MU and not TUD. All of the above.
- The revenue for a product is R(x) = −0.004x^2 + 21x − 6200 and thecost is C(x) = 0.02x + 38, for x units produced and sold.Should output be increased or decreased to generate a higher profit?(1) The revenue for a product is R(x) = −0.004x2 + 21x − 6200 and the cost is C(x) = 0.02x + 38, for x units produced and sold.(a) Find the marginal profit for 2800 units.(b) Should output be increased or decreased to generate a higher profit?Q, The demand for product is 6000 unit per year and the items are withdrawn uniformly. The order costis 10003, the inventory holding costis 63 per item per year, assuming shortages cost 125, find the following: 1. The Economic order quantity. 2. Maximum Inventory. 3. Shortage quantity. 4. Frequency .
- Please no written by hand solutions Suppose you own a store that sells top-of-the-line MP3 players. You have determined that the demand function for your MP3 players is Qd = D(P) = 1200 - 4P. At what price would you sell the MP3 players if you wanted to sell 200 of them?11- Al Shaihani is a halwa manufacturer which is famous for Omani Saffron Halwa. They wanted to increase their supply of halwa for the coming month of August 2021. However, due to COVID-19 Pandemic, the only available resources they could change are the number of their workers. Determine which type of production period Al Shaihani business is facing? a. Long run b. All of these c. Short - run d. Mid-runa. The firm's profit maximizing output level is ____ units. b. At the profit-maximizing level of output, the firm's profit-per unit is $ ___ and total profit is $_____ .
- Table 13-7The Flying Elvis Copter Rides Quantity TotalCost FixedCost VariableCost MarginalCost AverageFixedCost AverageVariableCost AverageTotalCost 0 $50 $50 $0 -- -- -- -- 1 $150 A B C D E F 2 G H I $120 J K L 3 M N O P Q $120 R Refer to Table 13-7. Fill in ALL THE VALUES FROM A to R in the table.6 A production function is given by f(x1,x2)=(max{x1,x2})^0.5. Prices of inputs are p1=10 and p2=20. What is the lowest cost of producing 10 units of output?1) A manufacturer of kitche. Appliances is preparing to set the price on a new blender. Demand is thought to depend on the proce qnd is represented by the following model. D= 2,800-4p The accounting department estimates that the total cost can be represented by the following model. C=4,700+5D Develop a mathematical model for the total profit of TP in terms of the price, P. A mathematical mod for the total profit in terms of the price P is TP= ______