(a) Fit a quadratic parabola to the following series of observations taking the years as independent variable. 1924 192719301933|1936|19391942 Years Index of coal prices 187 142 133 129|136| 169|279 Use your results to estimate the value of the index for 1935.
(a) Fit a quadratic parabola to the following series of observations taking the years as independent variable. 1924 192719301933|1936|19391942 Years Index of coal prices 187 142 133 129|136| 169|279 Use your results to estimate the value of the index for 1935.

Algebra & Trigonometry with Analytic Geometry
13th Edition
ISBN:9781133382119
Author:Swokowski
Publisher:Swokowski
Chapter11: Topics From Analytic Geometry
Section11.1: Parabolas
Problem 50E

Related questions

Concept explainers
Equations and Inequations
Equations and inequalities describe the relationship between two mathematical expressions.
Linear Functions
A linear function can just be a constant, or it can be the constant multiplied with the variable like x or y. If the variables are of the form, x2, x1/2 or y2 it is not linear. The exponent over the variables should always be 1.
Question
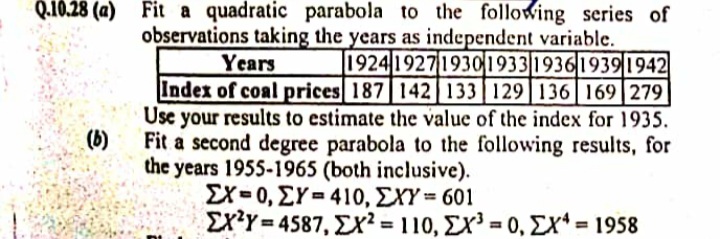
Transcribed Image Text:Q.10.28 (a) Fit a quadratic parabola to the following series of
observations taking the years as independent variable.
1924 1927 19301933|1936|19391942
Years
Index of coal prices 187 142| 133 129 136|169|279
Use your results to estimate the value of the index for 1935.
Fit a second degree parabola to the following results, for
the years 1955-1965 (both inclusive).
ΣΧ-0, ΣY= 410, ΣΥΎ = 601
ΣχΥ-4587, Σχ110 , Σχ-0, ΣΧ'-1958
(b)
Expert Solution
This question has been solved!
Explore an expertly crafted, step-by-step solution for a thorough understanding of key concepts.

Step by step
Solved in 2 steps with 1 images

Knowledge Booster


Learn more about
Need a deep-dive on the concept behind this application? Look no further. Learn more about this topic, statistics and related others by exploring similar questions and additional content below.Recommended textbooks for you
Algebra & Trigonometry with Analytic Geometry
Algebra
ISBN:
9781133382119
Author:
Swokowski
Publisher:
Cengage
Algebra & Trigonometry with Analytic Geometry
Algebra
ISBN:
9781133382119
Author:
Swokowski
Publisher:
Cengage