A frequency table displaying professor Blount's last statistic test is shown. Find the best estimate of the class mean. Grade Interval Number of Students 50-56.5 56.5-62.5 62.5-68.5 68.5-74.5 74.5-80.5 80.5-86.5 86.5-92.5 92.5-98.5 Table 2.25 Find the midpoints for all intervals 1 0 4 4 2 3 4 1
A frequency table displaying professor Blount's last statistic test is shown. Find the best estimate of the class mean. Grade Interval Number of Students 50-56.5 56.5-62.5 62.5-68.5 68.5-74.5 74.5-80.5 80.5-86.5 86.5-92.5 92.5-98.5 Table 2.25 Find the midpoints for all intervals 1 0 4 4 2 3 4 1

Holt Mcdougal Larson Pre-algebra: Student Edition 2012
1st Edition
ISBN:9780547587776
Author:HOLT MCDOUGAL
Publisher:HOLT MCDOUGAL
Chapter11: Data Analysis And Probability
Section11.1: Stem-and-leaf Plots And Histograms
Problem 1C

Related questions
Question
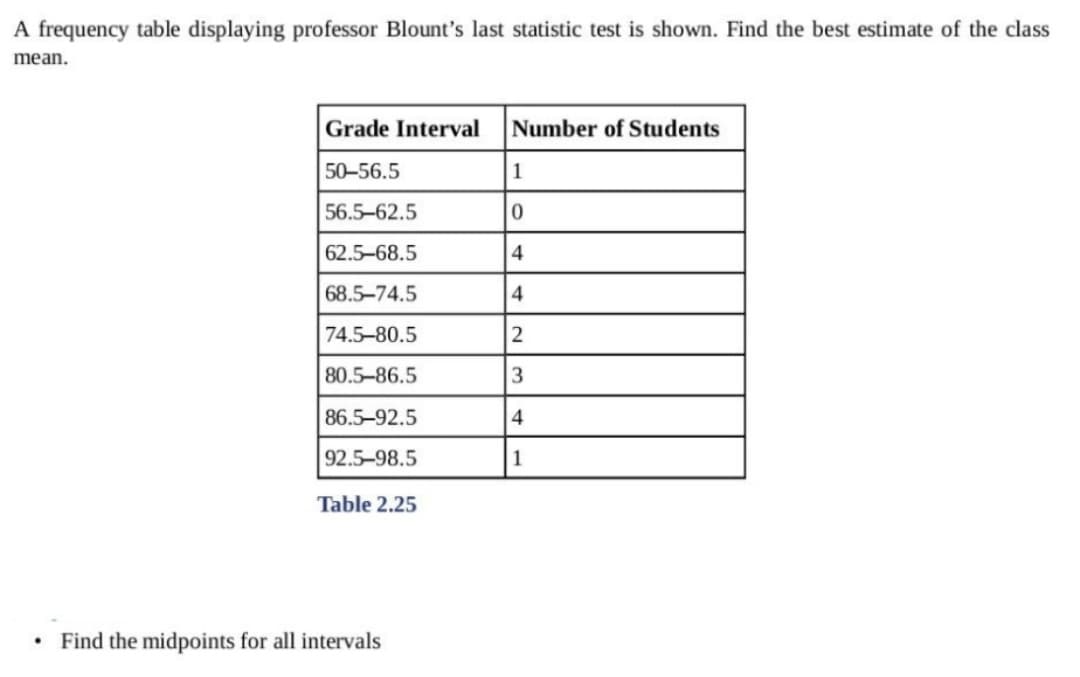
Transcribed Image Text:A frequency table displaying professor Blount's last statistic test is shown. Find the best estimate of the class
mean.
.
Grade Interval Number of Students
50-56.5
56.5-62.5
62.5-68.5
68.5-74.5
74.5-80.5
80.5-86.5
86.5-92.5
92.5-98.5
Table 2.25
Find the midpoints for all intervals
1
0
4
4
2
3
4
1
Expert Solution
This question has been solved!
Explore an expertly crafted, step-by-step solution for a thorough understanding of key concepts.

This is a popular solution!

Trending now
This is a popular solution!

Step by step
Solved in 2 steps with 2 images

Recommended textbooks for you
Holt Mcdougal Larson Pre-algebra: Student Edition…
Algebra
ISBN:
9780547587776
Author:
HOLT MCDOUGAL
Publisher:
HOLT MCDOUGAL

Glencoe Algebra 1, Student Edition, 9780079039897…
Algebra
ISBN:
9780079039897
Author:
Carter
Publisher:
McGraw Hill
Holt Mcdougal Larson Pre-algebra: Student Edition…
Algebra
ISBN:
9780547587776
Author:
HOLT MCDOUGAL
Publisher:
HOLT MCDOUGAL
Glencoe Algebra 1, Student Edition, 9780079039897…
Algebra
ISBN:
9780079039897
Author:
Carter
Publisher:
McGraw Hill