a) From the Statistics Canada dataset you have chosen, calculate the measures of central tendencies (mean, median and mode) and explain the meaning of each in a paragraph. b) Calculates measures of dispersion (standard deviation, variance, EI - Q3-Q1 Interquartile Range, Z scores, percentiles). c) From all the calculated spread metrics, explain which one would be an appropriate "statistical summary" for this dataset by demonstrating it through your calculations.
a) From the Statistics Canada dataset you have chosen, calculate the measures of central tendencies (mean, median and mode) and explain the meaning of each in a paragraph. b) Calculates measures of dispersion (standard deviation, variance, EI - Q3-Q1 Interquartile Range, Z scores, percentiles). c) From all the calculated spread metrics, explain which one would be an appropriate "statistical summary" for this dataset by demonstrating it through your calculations.

Glencoe Algebra 1, Student Edition, 9780079039897, 0079039898, 2018
18th Edition
ISBN:9780079039897
Author:Carter
Publisher:Carter
Chapter10: Statistics
Section10.5: Comparing Sets Of Data
Problem 24HP

Related questions
Question
Instructions:
Please answer these a.b.c questions.
(2) 3.1
DO NOT use excel.
Please explain well by your knowledge, written by yourself on a paper or else.
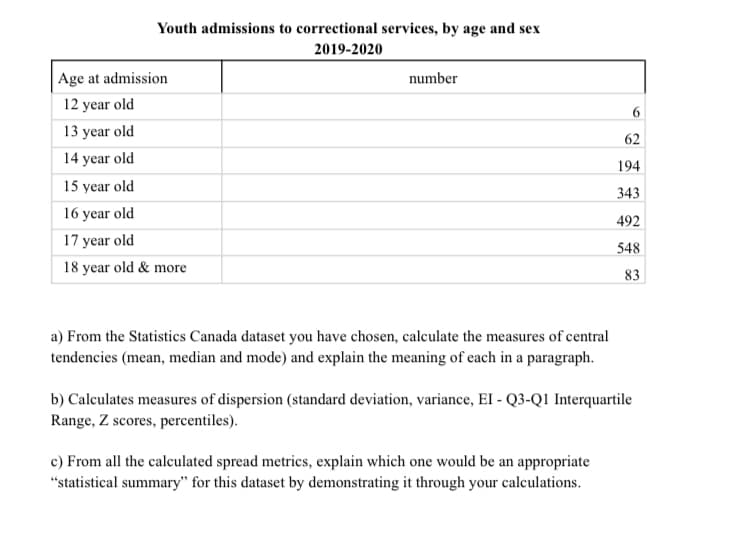
Transcribed Image Text:Youth admissions to correctional services, by age and sex
2019-2020
Age at admission
12 year old
13 year old
14 year old
15 year old
16 year old
17
year old
18 year old & more
number
a) From the Statistics Canada dataset you have chosen, calculate the measures of central
tendencies (mean, median and mode) and explain the meaning of each in a paragraph.
62
194
343
492
548
83
b) Calculates measures of dispersion (standard deviation, variance, EI - Q3-Q1 Interquartile
Range, Z scores, percentiles).
c) From all the calculated spread metrics, explain which one would be an appropriate
"statistical summary" for this dataset by demonstrating it through your calculations.
Expert Solution
This question has been solved!
Explore an expertly crafted, step-by-step solution for a thorough understanding of key concepts.

This is a popular solution!

Trending now
This is a popular solution!

Step by step
Solved in 6 steps with 7 images

Recommended textbooks for you
Glencoe Algebra 1, Student Edition, 9780079039897…
Algebra
ISBN:
9780079039897
Author:
Carter
Publisher:
McGraw Hill
Glencoe Algebra 1, Student Edition, 9780079039897…
Algebra
ISBN:
9780079039897
Author:
Carter
Publisher:
McGraw Hill