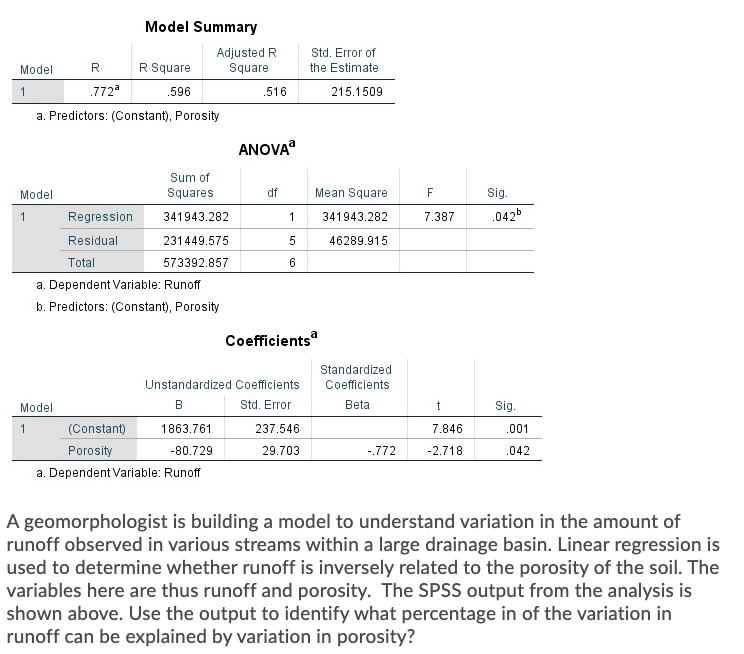
A geomorphologist is building a model to understand variation in the amount of runoff observed in various streams within a large drainage basin. Linear regression is used to determine whether runoff is inversely related to the porosity of the soil. The variables here are thus runoff and porosity. The SPSS output from the analysis is shown above. Use the output to identify what percentage in of the variation in runoff can be explained by variation in porosity?
Q: Which test was better?. Gina took a midterm in her math class and her biology class. After she gets ...
A: The objective is to calculate z score for math test for Gina. we have given x=47 mean(x)=39 Sd(σ)...
Q: According to Cohen's conventions, an R2 of 0.19 is considered to be a(n) effect size. erroneous larg...
A: We have given that, According to Cohen’s convention, an R2 is 0.19.
Q: For the folowing set 4 data 13,16, 15, 22, 26, 32,37, 37, 40,244, 47, 55, 59, 62, 67, 77,78, 83 a) C...
A: Solution: Count marks to determine the total frequency of each class. Class Class Boundaries Freq...
Q: When doing polling, for instance to figure out how popular a given candidate is, a common trick is t...
A: From the given information, There are N people for testing whether they support that candidate or no...
Q: Let U and V be uncorrelated random variables. Consider U = X + Y and V = X. a. Find Cov(U,V). b. Is ...
A: Given that Let U and V are uncorrected U=X+Y and V=X We have to find a..Cov(U,V) b..is there a...
Q: The calculations for a factorial experiment involving four levels of factor A, three levels of facto...
A: From the given table Set up Anova table and test any significant main effect and interaction effect
Q: In Tukey's HSD post-hoc test, the HSD stands for: honestly standardized difference. O honorary stand...
A: In Turkey HSD post-hoc test, the HSD stands for
Q: . 5. The following series relates to the marks secured by students in an examination. Marks No. of s...
A: Solution is given:
Q: Determine the probability density function for the following cumulative distribution function. x < 0...
A: Given,F(x)=0; x<00.2x; 0≤x<40.04x+0.64; 4≤x<91; 9≤x
Q: The mean yearly salary paid to all employees in a company was k2,400,000. The mean yearly salaries p...
A:
Q: 7: Calculate D, and D, for the data given below : Class-interval 0-10 10-20 20-30 30-40 40-50 50-60 ...
A:
Q: 1. Give below is the data on production of a company (in lakhs). Year: 1983 1984 1985 1986 1987 1988...
A:
Q: Based on your decisions from the previous problem, find the correct number of possible options for e...
A:
Q: 2. Fit a trend equation of the form Y= a+ bX bY the method of least squares to the following data an...
A:
Q: :If Z = ax + by and yis the correlation coefficient between Xand Y. Show that (a) o = a°o% +b²o +2ab...
A: Solution for this question is as given:
Q: 1. For the following set of data. 13, 16, 15, 22, 26, 32, 37, 37, 40, 44, 47, 53, 55, 59, 62, 67, 77...
A:
Q: Download/open DJIAS P500.xlsx and run a regression report using DJIA to predict S&P 500. In the blan...
A: Enter the data as shown below in Excel.
Q: epare temperature on that day using z = 2.33. What probability, or level of confidence, will be atta...
A: We have given that the z-score z = 2.33
Q: Risk taking is an important part of investing. In order to make suitable investment decisions on beh...
A:
Q: I. A population consists of the values (1, 4, 3, 2). Consider samples of size 2 that can be drawn fr...
A: Here given population {1,4,3,2} Here sample of size 2 drawn from population
Q: Suppose that X has a lognormal distribution with parameters 0 = 2 and w² = 9. Determine the followin...
A: Note: P-value is taken from standard normal distribution table.
Q: Purchases made at small "corner stores" were studied by the authors of a certain paper. Corner store...
A:
Q: valid
A: Here use basic of hypothesis
Q: (d) Compute the 10% trimmed mean. Compare with the results in (a) and (b) and comment.
A: Data is given : We have to calculate 10%trimmed mean 1 : we have to arrange the data 2 : remove 10%...
Q: Determine the percentile rank of the following. (Please make the answer CLEAR so that I can underst...
A:
Q: A survey using a sample size of 11 reveals that the average size of dairy farms in Simcoe County is ...
A:
Q: ou have chosen three breeds of chicken for your farm after studying their egg-laying capabilities. O...
A: Given that you have chosen three breeds of chicken for your farm after studying their egg-laying cap...
Q: Find the regression equation showing the regression equation of capacity utilisation on production f...
A: Solution is given:
Q: Consider a memoryless discrete-time source which emits a sequence of random elements X1, X2,'· • , X...
A:
Q: plem Solving A. Instructions: Determine if the following situations use as random or non-random samp...
A: Note: As per the guidelines, in case of multiple questions, answer to first question will be provide...
Q: Match the Null Hypothesis to the mathmatical description:
A: Test is that whether the mean length of unemployment differs among the residents of two local commun...
Q: How many different samples of size n can be obtained from the following population N sizes? NCn 1. 4...
A: we know that NCn=N!N-n!×n!
Q: Innocent until proven guilty? In Japanese criminal trials, about 95% of the defendants are found gui...
A: Given: n = 11 p = 0.60 for US p = 0.95 for Japan We use binomial distribution here.
Q: PROBLEM L. Inscribed on the outside of King Tutankhamen's Tomb in Luxor, Egypt was the warning "Deat...
A: As per the Bartleby guildlines we have to solve first three subparts and rest can be reposted... Giv...
Q: Example 6 Calculate the mode by grouping method. 15-20 С.I.: 5-10 10-15 20-25 25-30 32 35 25 34 12
A: Mode=l+f1-f02f1-f0-f2×Cl=lower limit of mode classf1=frequency of mode classf0=frequency of the clas...
Q: The Mental Development Index (MDI) of the Bayley Scales of Infant Development is a standardized meas...
A:
Q: 1. Which of the following formulas is used to calculate the population standard deviation? A. o = E(...
A: Note: According to Bartleby guidelines expert solve only one question and rest can be reposted.
Q: 4. The data below represents the weights of patient fitted with a holter monitor (in pounds). 120 13...
A:
Q: In 2006 the mean weight of men was believed to be 86.8 kg. To test for an increase in the weight a r...
A: Given μ=86.8n=100x¯=88.7s=11.64α=0.05
Q: 14. A researcher used to develop a problem-solving test to randomly selected 100 Grade 11 students. ...
A: Given n=11, x̄=90, s=sample standard deviations=4, population mean=μ=88 Note: According to Bartleb...
Q: Suppose that X is a negative binomial random variable with p - 0.2 and r = 4. Determine the followin...
A: Given,A random variable X~Negative binomial(p=0.2 , r=4)P(X=x)=x-1r-1pr qx-r
Q: A resort plans to apportion 52 new toboggans among the four resorts based on the number of rooms in ...
A: Given :
Q: Зx + log dy find dx If y = 4 — Зх -
A:
Q: Let Y,, Y,, ..., Y, denote a random sample of size n from a population with a uniform distribution o...
A: Solution
Q: Chinovac Labs tried a new vaccine on 193 randomly selected individuals. From the experiment, it was ...
A:
Q: Find the mean. Round to the nearest tenth: 2, 3, 1, 4, 5, 2 Group of answer choices 3.4 2.8 2.83 2.9
A: Given data set is 2,3,1,4,5,2
Q: Using Euler's method, compute y (0-5) for differential equation =y -x, with y =1 when x=0
A:
Q: [item#2part2] Instructions: (PLEASE READ!! Kindly answer items iv-v only). Write a description and a...
A: As it is mentioned to answer parts (iv and v), we will answer parts (iv) and (v) from the given data...
Q: Fis obtained by dividing by O dfbetweeri SSpetween MSpetweeri MSwithin SSpetweeni df petween SSpetwe...
A: The F ratio is calculated as ratio of two sample variances.
Q: Let a population consist of the values 8 cigarettes, 20 cigarettes, and 21 cigarettes smoked in a da...
A: Given Let a population consist of the values 8 cigarettes, 20 cigarettes, and 21 cigarettes smoked i...
Step by step
Solved in 2 steps
- In a study of housing demand, the county assessor is interested in developing a regression model to estimate the market value (i.e., selling price) of residential property within his jurisdiction. The assessor feels that the most important variable affecting selling price (measured in thousands of dollars) is the size of house (measured in hundreds of square feet). He randomly selected 15 houses and measured both the selling price and size, as shown in the following table. OBSERVATIONi SELLING PRICE (× $1,000)Y SIZE (× 100 ft2 )X 1 2 3 4 5 6 7 8 9 10 11 12 13 14 15 265.2 279.6 311.2 328.0 352.0 281.2 288.4 292.8 356.0 263.2 272.4 291.2 299.6 307.6 320.4 12.0 20.2 27.0 30.0 30.0 21.4 21.6 25.2 37.2 14.4 15.0 22.4 23.9 26.6 30.7 a. Plot the data.b. Determine the estimated regression line. Give an economic interpretation of the estimated slope (b) coefficient.c. Determine if size is a statistically significant variable in estimating selling price.d. Calculate the coefficient…Cost accountants often estimate overhead based on the level of production. At the XYZ Company, they have collected information on overhead expenses and units produced at different plants and want to estimate a regression equation to predict future overhead. The data is available as given in the table below. Develop the regression equation for the cost accountants using Least Square Method. Predict overhead when 50 units are produced.=Make the prediction equation and interpret the slope within the context of the problem =State the hypotheses for the hypothesis test for regression. =make ANOVA table
- Draw a scatter diagram for the above data Obtain the regression equation by using least square method Predict the price of a house with a size of 28 square feetInterpret the slope of the least square regression line in content1. Use regression analysis to estimate the line of best fit -use the manual method with the formulas shown below.
- In a study of housing demand, the county assessor develops the following regression model to estimate the market value (i.e., selling price) of residential property within his jurisdiction. The assessor suspects that important variables affecting selling price (YY, measured in thousands of dollars) are the size of a house (X1X1, measured in hundreds of square feet), the total number of rooms (X2X2), age (X3X3), and whether or not the house has an attached garage (X4X4, No=0, Yes=1No=0, Yes=1). Y=α+β1X1+β2X2+β3X3+β4X4+εY=α+β1X1+β2X2+β3X3+β4X4+ε Now suppose that the estimate of the model produces following results: a=166.048a=166.048, b1=3.459b1=3.459, b2=8.015b2=8.015, b3=−0.319b3=−0.319, b4=1.186b4=1.186, sb1=1.079sb1=1.079, sb2=5.288sb2=5.288, sb3=0.789sb3=0.789, sb4=12.252sb4=12.252, R2=0.838R2=0.838, F-statistic=12.919F-statistic=12.919, and se=13.702se=13.702. Note that the sample consists of 15 randomly selected observations. According to the estimated model, holding all…Acrylamide is a chemical that is sometimes found in cooked starchy foods and which is thought to increase the risk of certain kinds of cancer. The paper "A Statistical Regression Model for the Estimation of Acrylamide Concentrations in French Fries for Excess Lifetime Cancer Risk Assessment"† describes a study to investigate the effect of x = frying time (in seconds) and y = acrylamide concentration (in micrograms per kg) in french fries. The data in the accompanying table are approximate values read from a graph that appeared in the paper. FryingTime AcrylamideConcentration 150 155 240 120 240 195 270 185 300 145 300 270 (a) Construct a scatterplot of these data. A scatterplot has 6 points. The horizontal axis is labeled "x" and ranges from 100 to 350. The vertical axis is labeled "y" and ranges from 50 to 350. The points are plotted from left to right in a downward, diagonal direction starting from the upper left of the diagram. Along the horizontal axis,…Acrylamide is a chemical that is sometimes found in cooked starchy foods and which is thought to increase the risk of certain kinds of cancer. The paper "A Statistical Regression Model for the Estimation of Acrylamide Concentrations in French Fries for Excess Lifetime Cancer Risk Assessment"† describes a study to investigate the effect of x = frying time (in seconds) and y = acrylamide concentration (in micrograms per kg) in French fries. The data in the accompanying table are approximate values read from a graph that appeared in the paper. FryingTime AcrylamideConcentration 150 155 240 115 240 190 270 180 300 140 300 265 (a) Construct a scatterplot of these data. A scatterplot has 6 points.The horizontal axis is labeled "x" and ranges from 100 to 350.The vertical axis is labeled "y" and ranges from 50 to 350.The points are plotted from left to right in a horizontal direction starting from the lower left side of the diagram.Along the horizontal axis, there is 1 point at 150, 2 points…
- Acrylamide is a chemical that is sometimes found in cooked starchy foods and which is thought to increase the risk of certain kinds of cancer. The paper "A Statistical Regression Model for the Estimation of Acrylamide Concentrations in French Fries for Excess Lifetime Cancer Risk Assessment"† describes a study to investigate the effect of x = frying time (in seconds) and y = acrylamide concentration (in micrograms per kg) in french fries. The data in the accompanying table are approximate values read from a graph that appeared in the paper. Frying Time Acrylamide Concentration 150 155 240 120 240 195 270 185 300 145 300 270 (a) Construct a scatterplot of these data. A scatterplot has 6 points. The horizontal axis is labeled "x" and ranges from 100 to 350. The vertical axis is labeled "y" and ranges from 50 to 350. The points are plotted from left to right in a downward, diagonal direction starting from the upper left of the diagram. Along the horizontal axis, there are 2 points at…Disk drives last time Here is a scatterplot of the residu-als from the regression of the hard drive prices on their sizes from Exercise 18.a) Are any assumptions or conditions violated? If so,which ones?b) What would you recommend about this regression?Issue of multicollinearity impacted the ‘validity and trustworthiness’ of a regression model. Demonstrate how this issue can be a problem by using appropriate hypothetical example.(INCLUDE TABLE AND FIGURES)