a good representation of the data How the graphic could be improved

Algebra & Trigonometry with Analytic Geometry
13th Edition
ISBN:9781133382119
Author:Swokowski
Publisher:Swokowski
Chapter7: Analytic Trigonometry
Section: Chapter Questions
Problem 41RE

Related questions
Question
write a paragraph that discusses:
- Why is this graphic might be needed for that specific topic
- Why the graphic is misleading or is a good representation of the data
- How the graphic could be improved
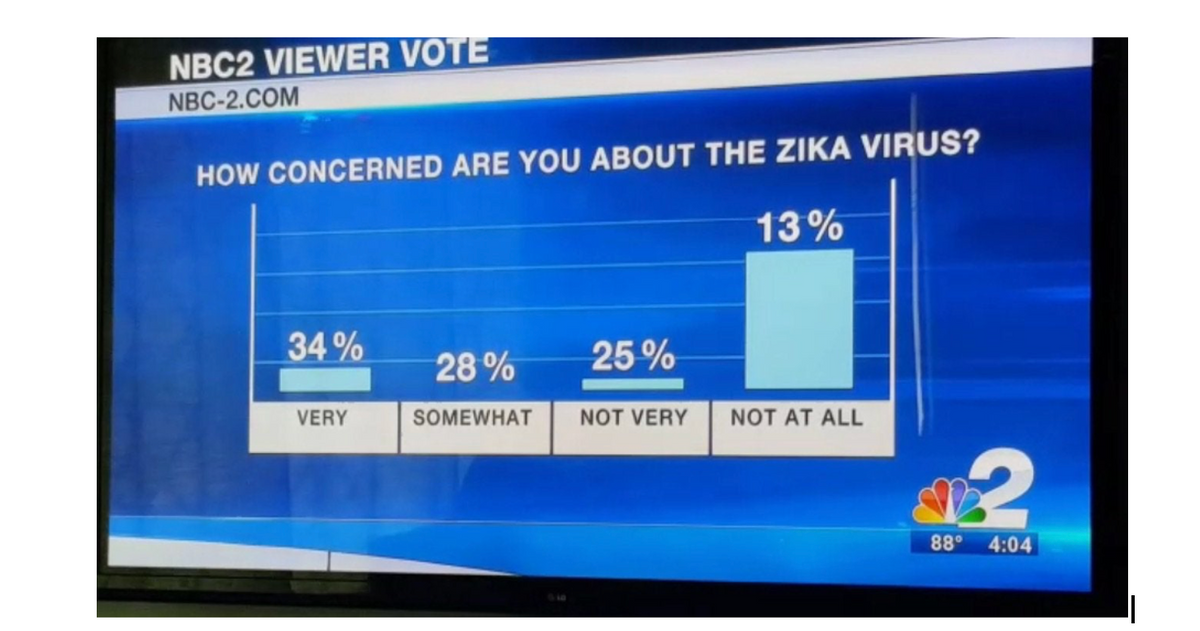
Transcribed Image Text:NBC2 VIEWER VOTE
NBC-2.COM
HOW CONCERNED ARE YOU ABOUT THE ZIKA VIRUS?
13%
34%
VERY
28% 25%
SOMEWHAT NOT VERY
NOT AT ALL
32
88°
4:04
Expert Solution
This question has been solved!
Explore an expertly crafted, step-by-step solution for a thorough understanding of key concepts.

Step by step
Solved in 2 steps

Recommended textbooks for you
Algebra & Trigonometry with Analytic Geometry
Algebra
ISBN:
9781133382119
Author:
Swokowski
Publisher:
Cengage

Trigonometry (MindTap Course List)
Trigonometry
ISBN:
9781305652224
Author:
Charles P. McKeague, Mark D. Turner
Publisher:
Cengage Learning
Algebra & Trigonometry with Analytic Geometry
Algebra
ISBN:
9781133382119
Author:
Swokowski
Publisher:
Cengage
Trigonometry (MindTap Course List)
Trigonometry
ISBN:
9781305652224
Author:
Charles P. McKeague, Mark D. Turner
Publisher:
Cengage Learning