A group of people were asked "What time do you prefer to see a movie? The two way table below represents the results by their age. 16-20 21-25 26-30 Over 30 Totals 4 12 25 43 Morning Afternoon 8. 12 18 32 70 Evening 28 34 28 11 101 Late Night 34 18 21 4 77 Totals 74 66 79 72 291 What the approximate probability that a person will select a late night movie given they are between the ages of 21-25? O 6% O 27% O 23% 18% 2.
A group of people were asked "What time do you prefer to see a movie? The two way table below represents the results by their age. 16-20 21-25 26-30 Over 30 Totals 4 12 25 43 Morning Afternoon 8. 12 18 32 70 Evening 28 34 28 11 101 Late Night 34 18 21 4 77 Totals 74 66 79 72 291 What the approximate probability that a person will select a late night movie given they are between the ages of 21-25? O 6% O 27% O 23% 18% 2.

Chapter8: Sequences, Series,and Probability
Section8.7: Probability
Problem 50E: Flexible Work Hours In a recent survey, people were asked whether they would prefer to work flexible...

Related questions
Question
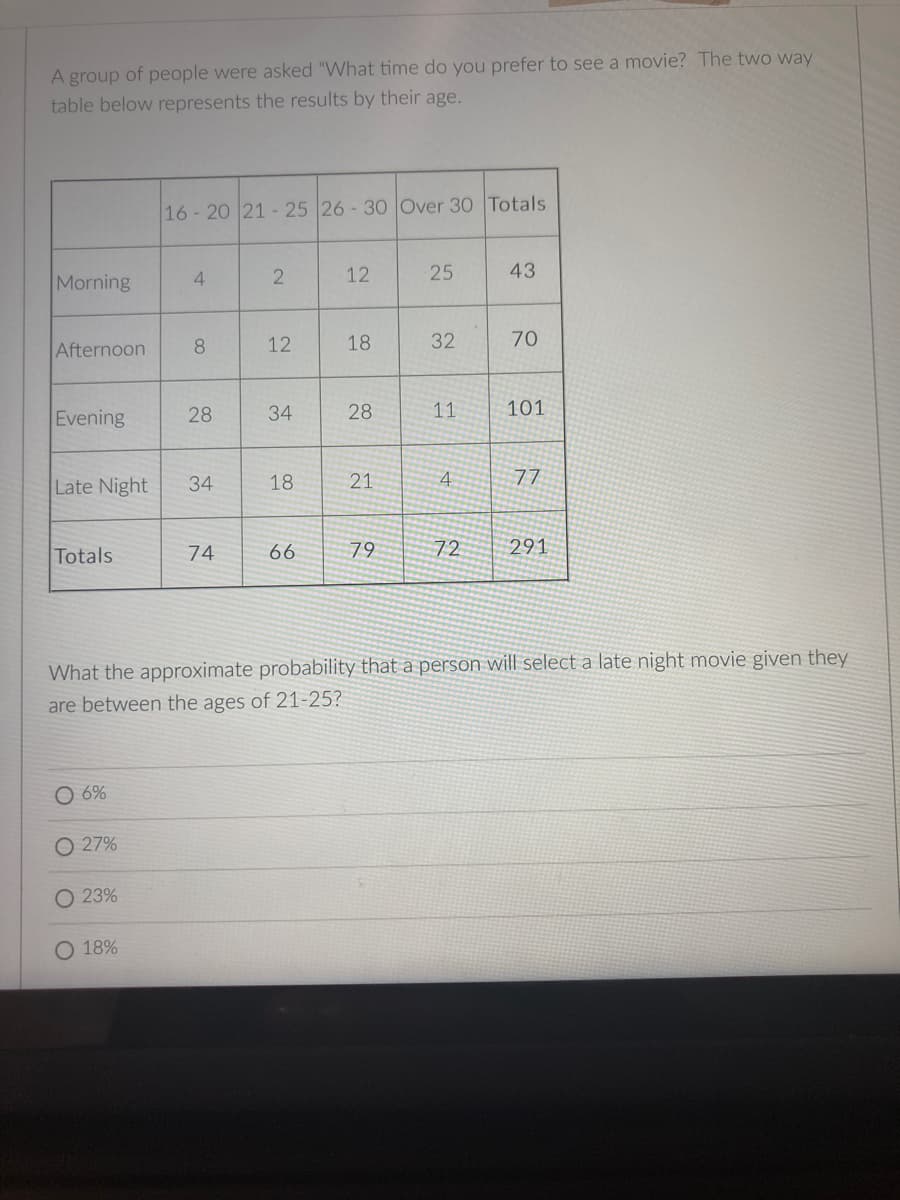
Transcribed Image Text:A group of people were asked "What time do you prefer to see a movie? The two way
table below represents the results by their age.
16- 20 21-25 26 -30 Over 30 Totals
Morning
4.
25
43
Afternoon
8
12
18
70
Evening
28
34
28
11
101
Late Night
34
18
21
4
77
Totals
74
66
79
72
291
What the approximate probability that a person will select a late night movie given they
are between the ages of 21-25?
O 6%
27%
O 23%
18%
32
12
2.
Expert Solution
This question has been solved!
Explore an expertly crafted, step-by-step solution for a thorough understanding of key concepts.

This is a popular solution!

Trending now
This is a popular solution!

Step by step
Solved in 3 steps with 3 images

Recommended textbooks for you