A high school physics teacher wondered if his students in the senior class this year will be more likely PSY230 Miller Spring A 2023 to go into STEM (Science, Technology, Engineering, Mathematics) majors than Social Science and Liberal Arts majors. He asked each of his 50 students about their first choice for major on their college applications and conducted a Chi-square test for goodness of fit with an alpha level of .05 to see if the number of students choosing each category differs significantly. 20 - STEM 20- Social Sciences 10- Liberal Arts
A high school physics teacher wondered if his students in the senior class this year will be more likely PSY230 Miller Spring A 2023 to go into STEM (Science, Technology, Engineering, Mathematics) majors than Social Science and Liberal Arts majors. He asked each of his 50 students about their first choice for major on their college applications and conducted a Chi-square test for goodness of fit with an alpha level of .05 to see if the number of students choosing each category differs significantly. 20 - STEM 20- Social Sciences 10- Liberal Arts

Holt Mcdougal Larson Pre-algebra: Student Edition 2012
1st Edition
ISBN:9780547587776
Author:HOLT MCDOUGAL
Publisher:HOLT MCDOUGAL
Chapter11: Data Analysis And Probability
Section: Chapter Questions
Problem 8CR

Related questions
Question
Calculate the X² statistic then compare it with the critical value to determine if we will reject or fail to reject the null hypothesis that "There is no difference in the proportion of students that choose STEM, Social Sciences and Liberal Arts"
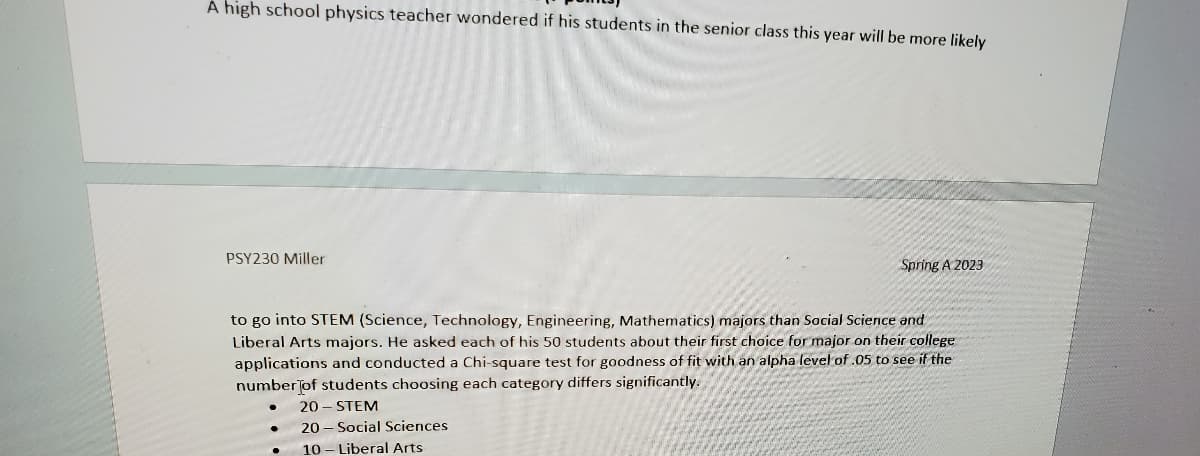
Transcribed Image Text:A high school physics teacher wondered if his students in the senior class this year will be more likely
PSY230 Miller
to go into STEM (Science, Technology, Engineering, Mathematics) majors than Social Science and
Liberal Arts majors. He asked each of his 50 students about their first choice for major on their college
applications and conducted a Chi-square test for goodness of fit with an alpha level of .05 to see if the
number of students choosing each category differs significantly.
20 - STEM
20 - Social Sciences
10- Liberal Arts
●
Spring A 2023
●
Expert Solution
Step 1
Given that,
The sample size
The level of significance
The student chooses the following categories.
The test statistics is
are observed frequencies
are expected frequencies

Trending now
This is a popular solution!

Step by step
Solved in 2 steps with 1 images

Recommended textbooks for you
Holt Mcdougal Larson Pre-algebra: Student Edition…
Algebra
ISBN:
9780547587776
Author:
HOLT MCDOUGAL
Publisher:
HOLT MCDOUGAL

Algebra & Trigonometry with Analytic Geometry
Algebra
ISBN:
9781133382119
Author:
Swokowski
Publisher:
Cengage
Holt Mcdougal Larson Pre-algebra: Student Edition…
Algebra
ISBN:
9780547587776
Author:
HOLT MCDOUGAL
Publisher:
HOLT MCDOUGAL
Algebra & Trigonometry with Analytic Geometry
Algebra
ISBN:
9781133382119
Author:
Swokowski
Publisher:
Cengage