A hospital spokesperson claims that the standard deviation of the waiting times experienced by patients in its minor emergency department is no more than 0.8 minutes. A random sample of 22 waiting times has a standard deviation of minutes. At a =0.05, is there enough evidence to reject the spokesperson's claim? Assume the population is normally distributed. Complete parts (a) through (e) below. EA Click the icon to view the Chi-Square Distribution Table. (a) Write the claim mathematically and identify Ho and Ha. O A. Hoia s0.8 (Claim); Hio > 0.8 O B. Hoio 20.8; H,io<0.8 (Claim) OC. Hoia = 0.8; Ho 0.8 (Claim) O D. Hoio <0.8 (Claim); H, 20.8 (b) Find the critical value(s). (Round to three decimal places as needed. Use a comma to separate answers as needed.) Identify the rejection region(s). Choose the correct graph below. OB. Oc. OD. OA. (c) Find the standardized test statistic for the x-test. 2= (Round to three decimal nlaces As needed) Click to select your answer(s).
A hospital spokesperson claims that the standard deviation of the waiting times experienced by patients in its minor emergency department is no more than 0.8 minutes. A random sample of 22 waiting times has a standard deviation of minutes. At a =0.05, is there enough evidence to reject the spokesperson's claim? Assume the population is normally distributed. Complete parts (a) through (e) below. EA Click the icon to view the Chi-Square Distribution Table. (a) Write the claim mathematically and identify Ho and Ha. O A. Hoia s0.8 (Claim); Hio > 0.8 O B. Hoio 20.8; H,io<0.8 (Claim) OC. Hoia = 0.8; Ho 0.8 (Claim) O D. Hoio <0.8 (Claim); H, 20.8 (b) Find the critical value(s). (Round to three decimal places as needed. Use a comma to separate answers as needed.) Identify the rejection region(s). Choose the correct graph below. OB. Oc. OD. OA. (c) Find the standardized test statistic for the x-test. 2= (Round to three decimal nlaces As needed) Click to select your answer(s).

Glencoe Algebra 1, Student Edition, 9780079039897, 0079039898, 2018
18th Edition
ISBN:9780079039897
Author:Carter
Publisher:Carter
Chapter10: Statistics
Section10.3: Measures Of Spread
Problem 26PFA

Related questions

Concept explainers
Contingency Table
A contingency table can be defined as the visual representation of the relationship between two or more categorical variables that can be evaluated and registered. It is a categorical version of the scatterplot, which is used to investigate the linear relationship between two variables. A contingency table is indeed a type of frequency distribution table that displays two variables at the same time.
Binomial Distribution
Binomial is an algebraic expression of the sum or the difference of two terms. Before knowing about binomial distribution, we must know about the binomial theorem.
Topic Video
Question
Transcribed Image Text:plete)
This Test: 30 pts poss
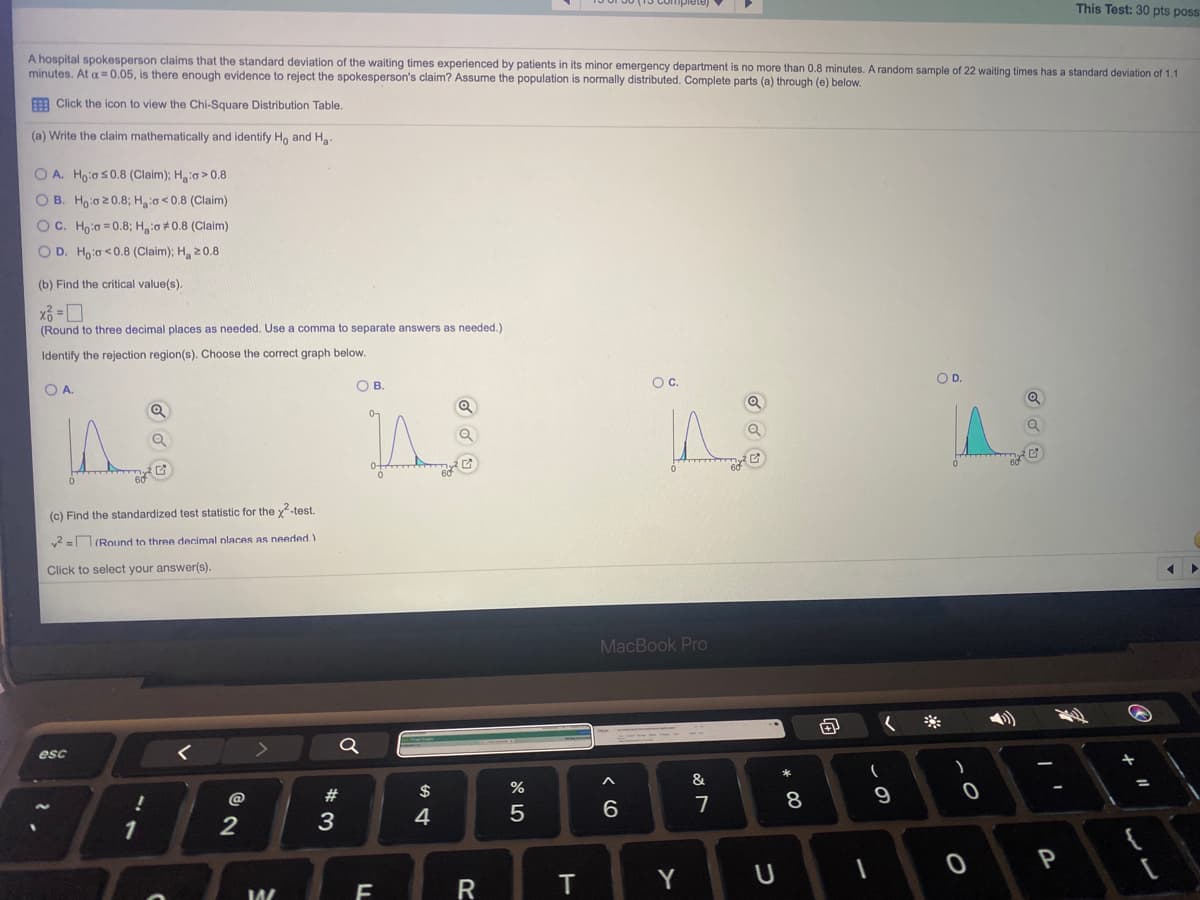
A hospital spokesperson claims that the standard deviation of the waiting times experienced by patients in its minor emergency department is no more than 0.8 minutes. A random sample of 22 waiting times has a standard deviation of 1.1
minutes. At a =0.05, is there enough evidence to reject the spokesperson's claim? Assume the population is normally distributed. Complete parts (a) through (e) below.
E Click the icon to view the Chi-Square Distribution Table.
(a) Write the claim mathematically and identify Ho and Ha.
O A. Hoia s0.8 (Claim); Ho > 0.8
O B. Hoio 20.8; Haio<0.8 (Claim)
OC. Hoia = 0.8; H:o 0.8 (Claim)
O D. Hoia <0.8 (Claim); H, 20.8
(b) Find the critical value(s).
(Round to three decimal places as needed. Use a comma to separate answers as needed.)
Identify the rejection region(s). Choose the correct graph below.
OC.
OD.
OA.
O B.
(c) Find the standardized test statistic for the x-test.
v2 = (Round to three decimal nlaces As needed.)
Click to select your answer(s).
MacBook Pro
esc
&
@
7
9
3
4
6.
1
2
P
R
T
Y
* CO
LL
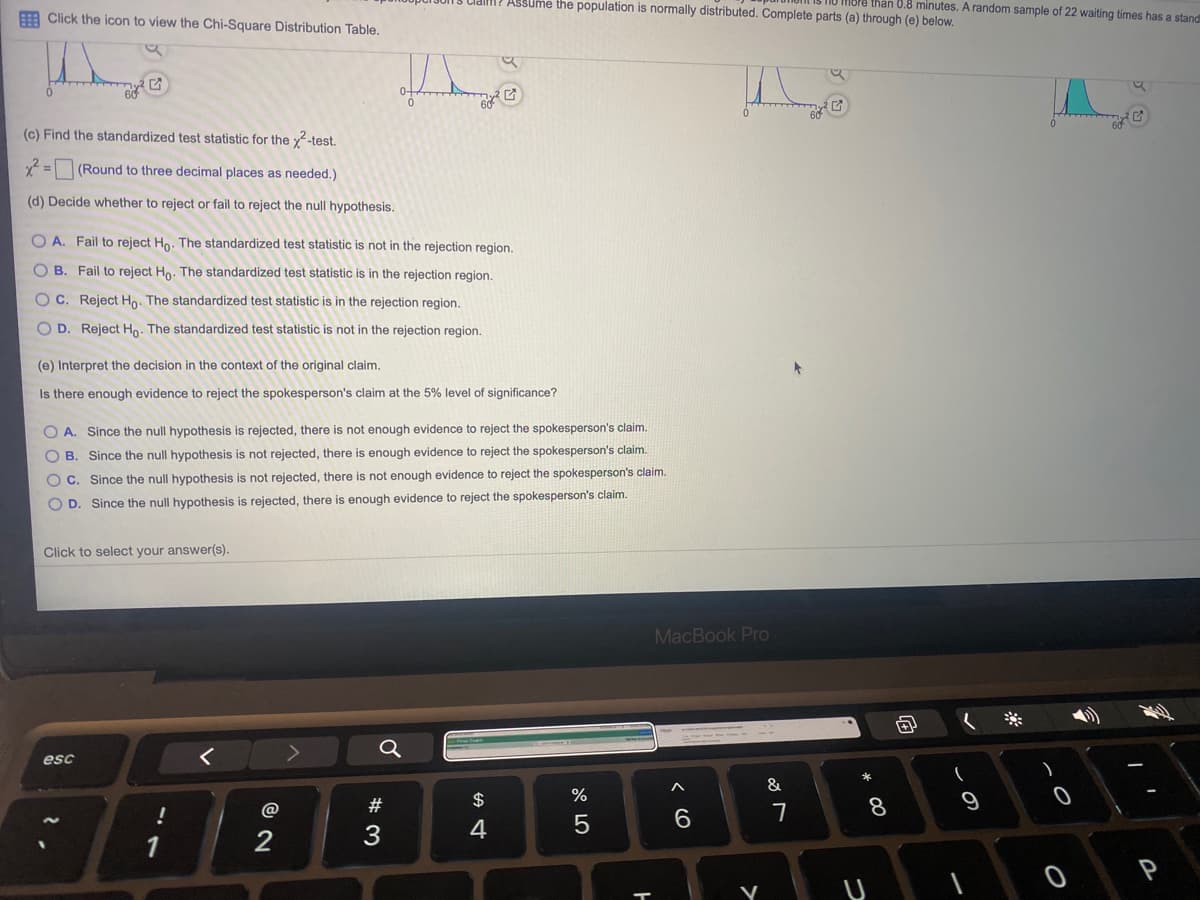
Transcribed Image Text:Assume the population is normally distributed. Complete parts (a) through (e) below.
MIBPE thân 0.8 minutes. A random sample of 22 waiting times has a stand
A Click the icon to view the Chi-Square Distribution Table.
(c) Find the standardized test statistic for the y2-test.
2 = (Round to three decimal places as needed.)
(d) Decide whether to reject or fail to reject the null hypothesis.
O A. Fail to reject Ho. The standardized test statistic is not in the rejection region.
O B. Fail to reject Ho. The standardized test statistic is in the rejection region.
O C. Reject Ho. The standardized test statistic is in the rejection region.
O D. Reject Ho. The standardized test statistic is not in the rejection region.
(e) Interpret the decision in the context of the original claim.
Is there enough evidence to reject the spokesperson's claim at the 5% level of significance?
O A. Since the null hypothesis is rejected, there is not enough evidence to reject the spokesperson's claim.
O B. Since the null hypothesis is not rejected, there is enough evidence to reject the spokesperson's claim.
O C. Since the null hypothesis is not rejected, there is not enough evidence to reject the spokesperson's claim.
O D. Since the null hypothesis is rejected, there is enough evidence to reject the spokesperson's claim.
Click to select your answer(s).
MacBook Pro
esc
$
%
9
@
7
3
4
* 00
< CO
Expert Solution
This question has been solved!
Explore an expertly crafted, step-by-step solution for a thorough understanding of key concepts.

This is a popular solution!

Trending now
This is a popular solution!

Step by step
Solved in 2 steps

Knowledge Booster


Learn more about
Need a deep-dive on the concept behind this application? Look no further. Learn more about this topic, statistics and related others by exploring similar questions and additional content below.Recommended textbooks for you
Glencoe Algebra 1, Student Edition, 9780079039897…
Algebra
ISBN:
9780079039897
Author:
Carter
Publisher:
McGraw Hill
Glencoe Algebra 1, Student Edition, 9780079039897…
Algebra
ISBN:
9780079039897
Author:
Carter
Publisher:
McGraw Hill