A hypothesis test is to be conducted to determine if the mean social marginality scores are not the same for all four age groups. That is, the following hypotheses will be tested. Ho: Hyouths = Young Adults #Adults Seniors H.: at least two of the four 's are different Since we are told to assume that it is reasonable to regard the four samples as representative of the U.S. population in the corresponding age groups and that the distributions of social marginality scores for these four groups are approximately normal with the same standard deviation, the assumptions for the ANOVA test have been met. When performing an ANOVA test, a table is helpful to organize values in calculation of the test statistic and corresponding P-value. Recall the format of a partial ANOVA table, given below. Source of Variation Treatments Error The given summary statistics are below. Age Group Youths Sample Size x 113 2.00 Degrees of Freedom 1.48 k-1 N-k Young Adults 244 3.70 1.78 Sum of Squares Mean Square 307 Adults Seniors 3.18 SSTR 1.58 SSE 48 2.72 1.98 SSTr k-1 SSE N-K = MSTr =MSE F= F MSTR MSE We will first focus on the column for Degrees of Freedom. The value of k is the number of populations being compared. Here, we are comparing the means of four age groups, so we have k = 4 and k-1 =3 The value of N is the total number of observations in the data set, so we have N = 113 +244 + 307 +48 = 712 Thus, the degrees of freedom for Error is N-k= 709 degrees of freedom for Treatments.
A hypothesis test is to be conducted to determine if the mean social marginality scores are not the same for all four age groups. That is, the following hypotheses will be tested. Ho: Hyouths = Young Adults #Adults Seniors H.: at least two of the four 's are different Since we are told to assume that it is reasonable to regard the four samples as representative of the U.S. population in the corresponding age groups and that the distributions of social marginality scores for these four groups are approximately normal with the same standard deviation, the assumptions for the ANOVA test have been met. When performing an ANOVA test, a table is helpful to organize values in calculation of the test statistic and corresponding P-value. Recall the format of a partial ANOVA table, given below. Source of Variation Treatments Error The given summary statistics are below. Age Group Youths Sample Size x 113 2.00 Degrees of Freedom 1.48 k-1 N-k Young Adults 244 3.70 1.78 Sum of Squares Mean Square 307 Adults Seniors 3.18 SSTR 1.58 SSE 48 2.72 1.98 SSTr k-1 SSE N-K = MSTr =MSE F= F MSTR MSE We will first focus on the column for Degrees of Freedom. The value of k is the number of populations being compared. Here, we are comparing the means of four age groups, so we have k = 4 and k-1 =3 The value of N is the total number of observations in the data set, so we have N = 113 +244 + 307 +48 = 712 Thus, the degrees of freedom for Error is N-k= 709 degrees of freedom for Treatments.

Glencoe Algebra 1, Student Edition, 9780079039897, 0079039898, 2018
18th Edition
ISBN:9780079039897
Author:Carter
Publisher:Carter
Chapter10: Statistics
Section10.4: Distributions Of Data
Problem 19PFA

Related questions
Question
correct me if im wrong ty!
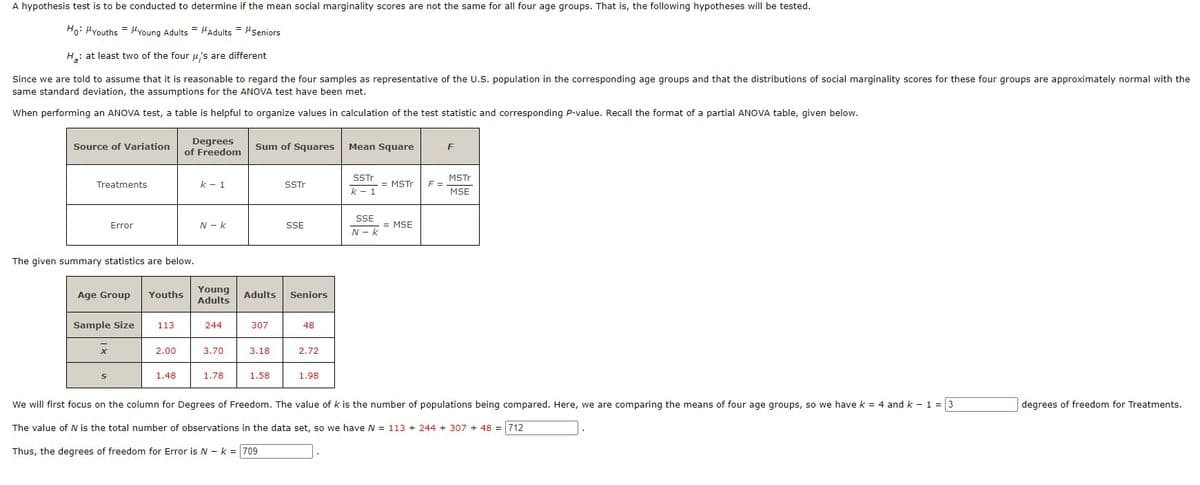
Transcribed Image Text:A hypothesis test is to be conducted to determine if the mean social marginality scores are not the same for all four age groups. That is, the following hypotheses will be tested.
Ho: "Youths = Young Adults Adults= "Seniors
H: at least two of the four μ's are different
Since we are told to assume that it is reasonable to regard the four samples as representative of the U.S. population in the corresponding age groups and that the distributions of social marginality scores for these four groups are approximately normal with the
same standard deviation, the assumptions for the ANOVA test have been met.
When performing an ANOVA test, a table is helpful to organize values in calculation of the test statistic and corresponding P-value. Recall the format of a partial ANOVA table, given below.
Source of Variation
Treatments
Error
Age Group
The given summary statistics are below.
Sample Size
X
S
113
=
2.00
Degrees
of Freedom
1.48
Youths Young
Adults
k - 1
N-K
244
3.70
1.78
Sum of Squares Mean Square
307
Adults Seniors
3.18
SSTr
1.58
SSE
48
2.72
1.98
SSTr
= MSTr
k - 1
SSE
N-K
= MSE
F =
F
MSTr
MSE
We will first focus on the column for Degrees of Freedom. The value of k is the number of populations being compared. Here, we are comparing the means of four age groups, so we have k = 4 and k - 1 = 3
The value of N is the total number of observations in the data set, so we have N = 113 +244 + 307 +48 = 712
Thus, the degrees of freedom for Error is N-k= 709
degrees of freedom for Treatments.
Expert Solution
This question has been solved!
Explore an expertly crafted, step-by-step solution for a thorough understanding of key concepts.

Step by step
Solved in 2 steps

Recommended textbooks for you
Glencoe Algebra 1, Student Edition, 9780079039897…
Algebra
ISBN:
9780079039897
Author:
Carter
Publisher:
McGraw Hill
Glencoe Algebra 1, Student Edition, 9780079039897…
Algebra
ISBN:
9780079039897
Author:
Carter
Publisher:
McGraw Hill