A Juarez, Mexico, manufacturer of roofing supplies has developed monthly forecasts for a family of products. Data for the 6-month period January to June are presented in the following table. The firm would like to begin development of an aggregate plan. Cost structure Inventory carrying cost/unit per month/backlog (or, under production) Subcontracting cost per unit Average pay rate/per hour Overtime pay rate/per hour when over 9 hrs a day Labor-hours to produce a unit Cost of increasing daily production rate (hiring and training) Cost of decreasing daily production rate (layoffs) Per day per labor working hours (Per unit cost is per hour cost * labor-hours to produce a unit) 4 50 20 30 1.6 350 700 8 Production/month Expected demand Production days Production/day Average daily requiremen Monthly inventory change Ending inventory 1 (Set up this chart correctly, you will receive 2%) Month Jan 1660 1200 22 Feb 1170 1250 18 Mar 1280 1300 22 Apr 1360 2000 20 May 1520 1300 22 Jun 1450 1390 21 Total 2. What is the total cost when using subcontractor with minimum constant workforce? (3%) (lowest per day production is based on production/day; not expected demand/day) Cost Regular-time labor Subcontracting Total Calculations 0 3. Set up the following hiring and layoff schedule (chase strategy) and calculate the final total cost: 3% (production days is same as E16:E21; using 4 decimal place for production/day) Forecast demand Production/day Basic prod.cost -monthly Extra hiring cost Layoff cost Total cost Month Production/month per month Jan 1660 1200 Feb 1170 1250 Mar 1280 1300 Apr 1360 2000 May 1520 1300 June 1450 1390 Total 8440 8440 0 $0.00 4. Using transportation modeling to calculate total cost by using regular (integer)labor and subcontrac (you need to build your own cost structure grid) 4% Month Tan Jan Feb $0.00 $0.00 $0.00 Lowest per day production Regular labor production Mar Apr May Jun Produced Limits Production days 22 Regular employees
A Juarez, Mexico, manufacturer of roofing supplies has developed monthly forecasts for a family of products. Data for the 6-month period January to June are presented in the following table. The firm would like to begin development of an aggregate plan. Cost structure Inventory carrying cost/unit per month/backlog (or, under production) Subcontracting cost per unit Average pay rate/per hour Overtime pay rate/per hour when over 9 hrs a day Labor-hours to produce a unit Cost of increasing daily production rate (hiring and training) Cost of decreasing daily production rate (layoffs) Per day per labor working hours (Per unit cost is per hour cost * labor-hours to produce a unit) 4 50 20 30 1.6 350 700 8 Production/month Expected demand Production days Production/day Average daily requiremen Monthly inventory change Ending inventory 1 (Set up this chart correctly, you will receive 2%) Month Jan 1660 1200 22 Feb 1170 1250 18 Mar 1280 1300 22 Apr 1360 2000 20 May 1520 1300 22 Jun 1450 1390 21 Total 2. What is the total cost when using subcontractor with minimum constant workforce? (3%) (lowest per day production is based on production/day; not expected demand/day) Cost Regular-time labor Subcontracting Total Calculations 0 3. Set up the following hiring and layoff schedule (chase strategy) and calculate the final total cost: 3% (production days is same as E16:E21; using 4 decimal place for production/day) Forecast demand Production/day Basic prod.cost -monthly Extra hiring cost Layoff cost Total cost Month Production/month per month Jan 1660 1200 Feb 1170 1250 Mar 1280 1300 Apr 1360 2000 May 1520 1300 June 1450 1390 Total 8440 8440 0 $0.00 4. Using transportation modeling to calculate total cost by using regular (integer)labor and subcontrac (you need to build your own cost structure grid) 4% Month Tan Jan Feb $0.00 $0.00 $0.00 Lowest per day production Regular labor production Mar Apr May Jun Produced Limits Production days 22 Regular employees

Practical Management Science
6th Edition
ISBN:9781337406659
Author:WINSTON, Wayne L.
Publisher:WINSTON, Wayne L.
Chapter9: Decision Making Under Uncertainty
Section: Chapter Questions
Problem 46P

Related questions
Question
Please show me how to solve this practice problem. Please be clear, Thank You
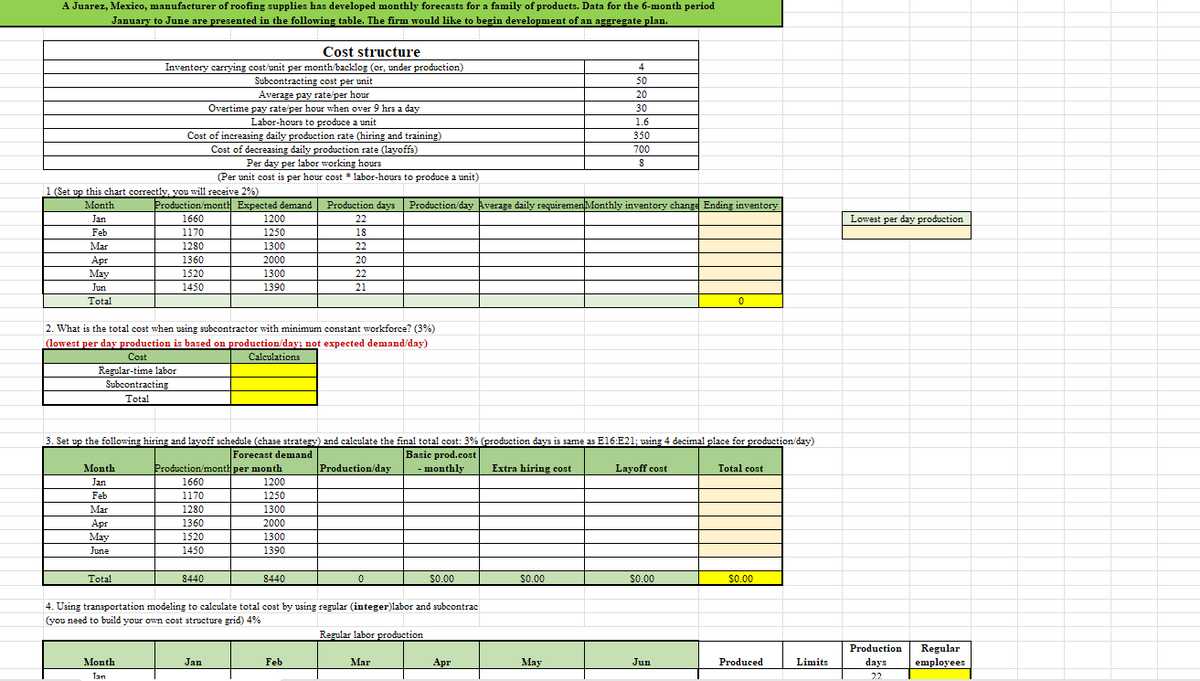
Transcribed Image Text:A Juarez, Mexico, manufacturer of roofing supplies has developed monthly forecasts for a family of products. Data for the 6-month period
January to June are presented in the following table. The firm would like to begin development of an aggregate plan.
Cost structure
Inventory carrying cost/unit per month/backlog (or, under production)
Subcontracting cost per unit
Average pay rate/per hour
Overtime pay rate/per hour when over 9 hrs a day
Labor-hours to produce a unit
Cost of increasing daily production rate (hiring and training)
Cost of decreasing daily production rate (layoffs)
Per day per labor working hours
(Per unit cost is per hour cost * labor-hours to produce a unit)
4
50
20
30
1.6
350
700
8
Production/month Expected demand Production days Production/day Average daily requiremen Monthly inventory change Ending inventory
1 (Set up this chart correctly, you will receive 2%)
Month
Jan
1660
1200
22
Feb
1170
1250
18
Mar
1280
1300
22
Apr
1360
2000
20
May
1520
1300
22
Jun
1450
1390
21
Total
2. What is the total cost when using subcontractor with minimum constant workforce? (3%)
(lowest per day production is based on production/day; not expected demand/day)
Cost
Regular-time labor
Subcontracting
Total
Calculations
0
3. Set up the following hiring and layoff schedule (chase strategy) and calculate the final total cost: 3% (production days is same as E16:E21; using 4 decimal place for production/day)
Forecast demand
Production/day
Basic prod.cost
-monthly
Extra hiring cost
Layoff cost
Total cost
Month
Production/month per month
Jan
1660
1200
Feb
1170
1250
Mar
1280
1300
Apr
1360
2000
May
1520
1300
June
1450
1390
Total
8440
8440
0
$0.00
4. Using transportation modeling to calculate total cost by using regular (integer)labor and subcontrac
(you need to build your own cost structure grid) 4%
Month
Tan
Jan
Feb
$0.00
$0.00
$0.00
Lowest
per day production
Regular labor production
Mar
Apr
May
Jun
Produced
Limits
Production
days
22
Regular
employees
Expert Solution
This question has been solved!
Explore an expertly crafted, step-by-step solution for a thorough understanding of key concepts.

Step by step
Solved in 2 steps

Recommended textbooks for you
Practical Management Science
Operations Management
ISBN:
9781337406659
Author:
WINSTON, Wayne L.
Publisher:
Cengage,

Purchasing and Supply Chain Management
Operations Management
ISBN:
9781285869681
Author:
Robert M. Monczka, Robert B. Handfield, Larry C. Giunipero, James L. Patterson
Publisher:
Cengage Learning

Marketing
Marketing
ISBN:
9780357033791
Author:
Pride, William M
Publisher:
South Western Educational Publishing
Practical Management Science
Operations Management
ISBN:
9781337406659
Author:
WINSTON, Wayne L.
Publisher:
Cengage,
Purchasing and Supply Chain Management
Operations Management
ISBN:
9781285869681
Author:
Robert M. Monczka, Robert B. Handfield, Larry C. Giunipero, James L. Patterson
Publisher:
Cengage Learning
Marketing
Marketing
ISBN:
9780357033791
Author:
Pride, William M
Publisher:
South Western Educational Publishing