A large bag contains 29 balls of different colors. The balls are of the same size, weight, surface, such that besides the color they cannot be differentiated. Among the 29 balls, 8 are green, 4 are yellow, 6 are red, 5 are blue, and 6 are black. (a) What is the probability of getting exactly 1 green, 1 yellow and 2 red when pulling 8 balls? number (rtol-0.01, atol=D0.0001) (b) What is the probability of getting first a green, then another green, and then in any order 2 yellow and 2 red when pulling 6 balls? number (rtol=D0.01, atol=D0.0001) (c) What is the probability of getting first and last a green, and then in any order 2 yellow and 2 red when pulling 8 balls? (Note: If there are remaining balls, they need to be either blue or black) number (rtol-D0.01, atol=D0.0001)
A large bag contains 29 balls of different colors. The balls are of the same size, weight, surface, such that besides the color they cannot be differentiated. Among the 29 balls, 8 are green, 4 are yellow, 6 are red, 5 are blue, and 6 are black. (a) What is the probability of getting exactly 1 green, 1 yellow and 2 red when pulling 8 balls? number (rtol-0.01, atol=D0.0001) (b) What is the probability of getting first a green, then another green, and then in any order 2 yellow and 2 red when pulling 6 balls? number (rtol=D0.01, atol=D0.0001) (c) What is the probability of getting first and last a green, and then in any order 2 yellow and 2 red when pulling 8 balls? (Note: If there are remaining balls, they need to be either blue or black) number (rtol-D0.01, atol=D0.0001)

Algebra & Trigonometry with Analytic Geometry
13th Edition
ISBN:9781133382119
Author:Swokowski
Publisher:Swokowski
Chapter10: Sequences, Series, And Probability
Section10.8: Probability
Problem 19E

Related questions

Concept explainers
Contingency Table
A contingency table can be defined as the visual representation of the relationship between two or more categorical variables that can be evaluated and registered. It is a categorical version of the scatterplot, which is used to investigate the linear relationship between two variables. A contingency table is indeed a type of frequency distribution table that displays two variables at the same time.
Binomial Distribution
Binomial is an algebraic expression of the sum or the difference of two terms. Before knowing about binomial distribution, we must know about the binomial theorem.
Topic Video
Question
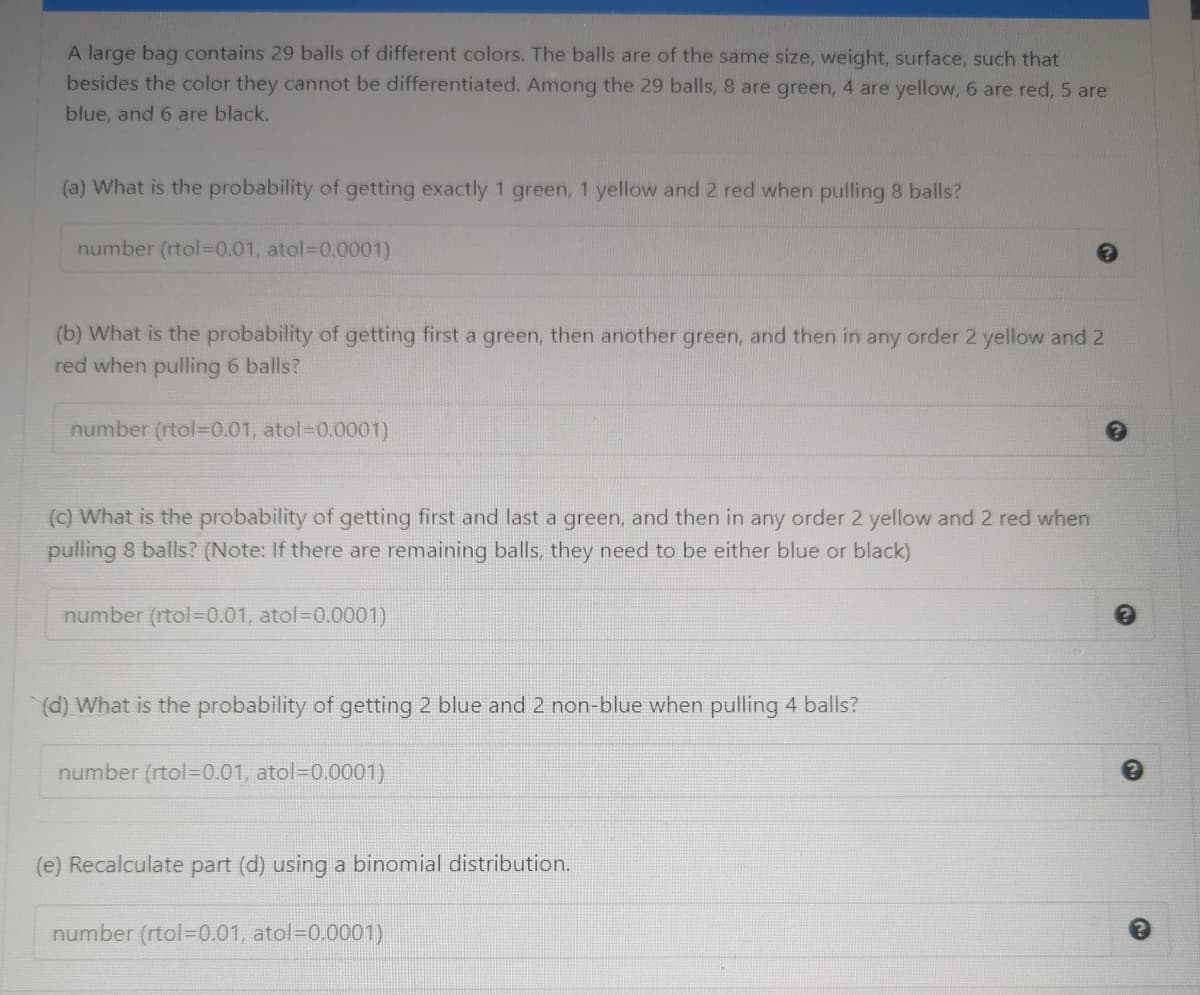
Transcribed Image Text:A large bag contains 29 balls of different colors. The balls are of the same size, weight, surface, such that
besides the color they cannot be differentiated. Among the 29 balls, 8 are green, 4 are yellow, 6 are red, 5 are
blue, and 6 are black.
(a) What is the probability of getting exactly 1 green, 1 yellow and 2 red when pulling 8 balls?
number (rtol-0.01, atol=D0.0001)
(b) What is the probability of getting first a green, then another green, and then in any order 2 yellow and 2
red when pulling 6 balls?
number (rtol-0.01, atol-D0.0001)
(c) What is the probability of getting first and last a green, and then in any order 2 yellow and 2 red when
pulling 8 balls? (Note: If there are remaining balls, they need to be either blue or black)
number (rtol-0.01, atol=D0.0001)
(d) What is the probability of getting 2 blue and 2 non-blue when pulling 4 balls?
number (rtol-D0.01, atol=0.0001)
(e) Recalculate part (d) using a binomial distribution.
number (rtol=D0.01, atol=D0.0001)
Expert Solution
This question has been solved!
Explore an expertly crafted, step-by-step solution for a thorough understanding of key concepts.

This is a popular solution!

Trending now
This is a popular solution!

Step by step
Solved in 6 steps

Knowledge Booster


Learn more about
Need a deep-dive on the concept behind this application? Look no further. Learn more about this topic, statistics and related others by exploring similar questions and additional content below.Recommended textbooks for you
Algebra & Trigonometry with Analytic Geometry
Algebra
ISBN:
9781133382119
Author:
Swokowski
Publisher:
Cengage
Algebra & Trigonometry with Analytic Geometry
Algebra
ISBN:
9781133382119
Author:
Swokowski
Publisher:
Cengage