A line of best fit was drawn for 15 data points. What is the maximum number of these data points that may not actually be on the line? O A. 12 O B. 15 O C. 13 D. 14
A line of best fit was drawn for 15 data points. What is the maximum number of these data points that may not actually be on the line? O A. 12 O B. 15 O C. 13 D. 14

Glencoe Algebra 1, Student Edition, 9780079039897, 0079039898, 2018
18th Edition
ISBN:9780079039897
Author:Carter
Publisher:Carter
Chapter10: Statistics
Section10.5: Comparing Sets Of Data
Problem 14PPS

Related questions
Question
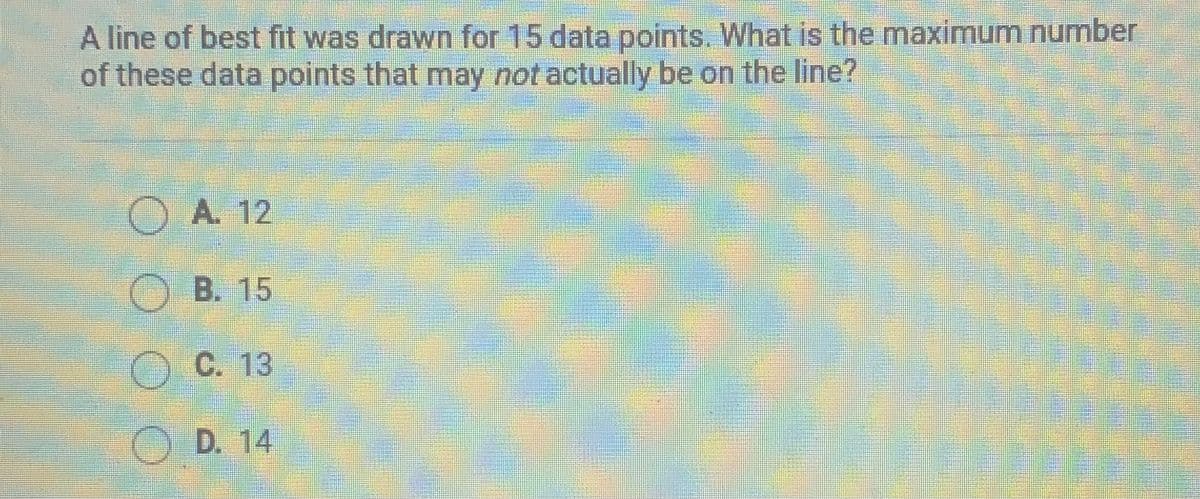
Transcribed Image Text:A line of best fit was drawn for 15 data points. What is the maximum number
of these data points that may not actually be on the line?
O A. 12
O B. 15
OC. 13
OD. 14
Expert Solution
This question has been solved!
Explore an expertly crafted, step-by-step solution for a thorough understanding of key concepts.

This is a popular solution!

Trending now
This is a popular solution!

Step by step
Solved in 2 steps

Recommended textbooks for you
Glencoe Algebra 1, Student Edition, 9780079039897…
Algebra
ISBN:
9780079039897
Author:
Carter
Publisher:
McGraw Hill
Glencoe Algebra 1, Student Edition, 9780079039897…
Algebra
ISBN:
9780079039897
Author:
Carter
Publisher:
McGraw Hill