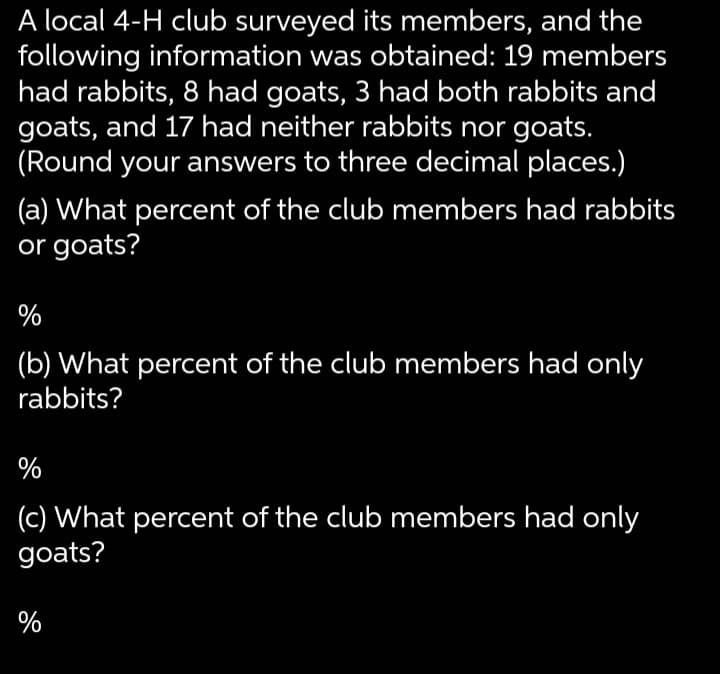
A local 4-H club surveyed its members, and the following information was obtained: 19 members had rabbits, 8 had goats, 3 had both rabbits and goats, and 17 had neither rabbits nor goats. (Round your answers to three decimal places.) (a) What percent of the club members had rabbits or goats? % (b) What percent of the club members had only rabbits? % (c) What percent of the club members had only goats? %


Q: During the first 13 weeks of the television season, the Saturday evening 8:00 P.M. to 9:00 P.M.…
A: Total number of house for sample are 300. ABC 95 homes, CBS 64 homes, NBC 81 homes, and…
Q: Do cigarette filters appear to be effective? O A. No, because the relative frequency of the higher…
A: Correct option is B.
Q: For a population with μ = 80 and σ = 10,what is the X value corresponding to z = -0.50?
A: Given information Mean (µ) = 80 Standard Deviation(σ) = 10 Z = -0.50 Z-score is given by the…
Q: For the following scores, Participant X Y A 2 6 B 3 3 C 4 2 D 7 1 Draw a scatterplot…
A: Procedure to draw scatter plot: Draw the x axis starting from 0 to 8 with 1 unit scale. Draw the y…
Q: If you have a z-score of 4.00 and the body proportion is .99997 and the question is asking for the…
A: The z-score is given by 4.
Q: e) From the analysis of students' marks, Mr Adam decided to do one-to-one consultation with his…
A: According to the information given in the problem we proceed as follows,
Q: A local 4-H club surveyed its members, and the following information was obtained: 18 members had…
A: a.) 36.84% b.) 31.58% c.) 5.26% explanation is given in below step
Q: Problem 26 "Streaming" of television programs is trending upward. According to The Harris Poll…
A: Let 'p' denote the number of TV viewers who have subscription. And, a poll of 2242 TV viewers was…
Q: You are told that your IQ scores falls at the 79th percentile. What conclusion could you make about…
A: Percentiles: If the elements in the data set are arranged in ascending order of magnitude, then the…
Q: In a study of over 15,000 teens, 62% of boys and 55% of girls consumed sugar-sweetened soda on the…
A:
Q: Below are the scores of 35 grade 11 students in the final examinations in Mathematics. 61 76…
A: Since you have posted a question with multiple subparts, we will solve the first three complete…
Q: Refer to Table 2-1. The percentage or proportion associated with X = 3 is __________. Table 2-1 X…
A: The probability formula is, Probability=Favourable outcomesTotal outcomes There are totally 10…
Q: 1) what proportion of students scored above student 33 on homework 3? 2) what proportion of students…
A: Given: Student ID HW 1 HW 2 HW 3 1 98 93 99 2 81 80 64 3 66 91 75.5 4 84 94 80 5 65…
Q: The following table shows the (population) frequencies of various types of patients with a…
A: Hello! As you have posted more than 3 sub parts, we are answering the first 3 sub-parts. In case…
Q: The following questions should be completed and your answers brought to class. Spending on Baseball…
A: Given graph: The given graph is a bar graph. In bar graph, height or length of the bars are…
Q: The following questions highlight how changes in numbers can be measured in both absolute and…
A:
Q: From the information in the article, in a town consisting of 2,300 rich students born in 1980, how…
A: The total number of rich students in 1980 = 2300Here the graph is plotted parents Income percentile…
Q: A local anime fan club surveyed its members regarding their viewing habits last weekend, and the…
A:
Q: QUESTION 4 A men's shop with an initial markup of 59% had markdowns of 10%, employee discounts of…
A:
Q: During the first 13 weeks of the television season, the Saturday evening 8:00 P.M. to 9:00 P.M.…
A: The study shows the audience proportion of viewing television season, and viewing audience data.
Q: The table to the right shows the number of people testing positive for a certain disease amongst…
A: Required probability is P(tested positive | have disease)
Q: What percentage of scores fall between the following z scores: -1 to +1; -1 to +2; and -1 to +3?
A: a) -1 to +1 = P(-1<z<1) = P(Z<1)-P(Z<-1) =0.8413-0.1587 =0.6826 =68.26%
Q: QUESTION 1 A student has received the following marks Test No 1 Test No. 2 57 9% Test No. 3 Test No…
A: Explained below
Q: vision yielded the following viewing audience data: ABC 95 homes, CBS 64 homes, NBC81 homes, and…
A: A sample of 300 homes was taken Audience proportions were recorded as ABC 29% , CBS 28% , NBC 24% ,…
Q: Question 6 You recently performed a survey regarding the popularity of four fast food restaurants.…
A: Data visualization is the process of denoting the numerical data visually. Data visualization can be…
Q: The following data correspond to the grades obtained by the students of a course: 4,0 - 5,0 - 4,0 -…
A: 33 % F=frequencytotal frquency×100 f→frequency% C.F=C.FΣ…
Q: During the first 13 weeks of the television season, the Saturday evening 8:00 P.M. to 9:00 P.M.…
A: The null and alternative hypotheses are as follows: H0: p1=0.30, p2=0.27, p3=0.24, p4=0.19, H1: The…
Q: study was done to look at the relationship between number of vacation days employees take each year…
A: Solution: Let x = Vacation days and y = Sick days x y xy x2 y2 2 10 20 4 100 7 3 21 49 9…
Q: Question 2 Based on the scatterplot below, it appears there is at least one candidate outlier in…
A: Correlation A correlation coefficient is a statistical technique to assess the magnitude of the…
Q: In a given set of scores, the following data were obtained, the highest score is 83, the median…
A: A P percentile is the value in a dataset below which P percent of the data lies. A median is the…
Q: question 1 Dr. Hawk works in an allergy clinic, and his patients have the following allergies: 70…
A:
Q: A rental car company purchased a new Toyota Camry for $35,000. The company determined this asset…
A: NOTE: Refresh your page if you can't see any equations. . The company determined this asset should…
Q: In a survey on how much time university students spend online, for which of the following data sets…
A: While calculating the Pearson correlation r , we have two variables for which we determine the…
Q: 3. Below are the numbers of flights on time and delayed for Alaska Airlines at five airports in one…
A: Given data On time Delayed Total Los angeles 497 62 559 Phoenix 221 12…
Q: Sarah works for the Urban Pollination Project at UW. Five years ago, 25% of urban gardens were…
A: From the provided information, 25% of urban gardens were visited by native bees that is p = 0.25 The…
Q: The following table shows the results of a survey of authors by a (fictitious) publishing company.…
A: AS PER THE GUIDELINES I AM SOLVING 1ST QUESTION ONLY (BOTH PARTS ) FOR 2nd PLEASE ASK AS SEPARATE…
Q: The table below shows the number of state-registered automatic weapons and the murder rate for…
A: Given xx = thousands of automatic weaponsyy = murders per 100,000 residents
Q: A local 4-H club surveyed its members, and the following information was obtained: 14 members had…
A:
Q: What is the value of SS for this sample?
A: Given: n = 4 Σ X = 4 Σ X 2 = 32 The formula to calculate the SS is as follows:
Q: QUESTION 3 What percent of scores are below an SAT score of 560?
A: Mean of SAT score=mu=500 SD of SAT score=sigma=100 SAT score=x=560 Z-score=(x-mu)/sigma
Q: In a recent survey, a group of people were asked if they were happy or unhappy with the state of the…
A: Given data: Happy Unhappy Total Republican 152 98 250 Democrat 104 146 250 Total 256 244…
Q: Use the following to answer questions 4-8 A review of voter registration records in a small town…
A:
Q: 1. What percentage of scores fell within ±1 SD for ZADHD?
A: Introduction: The "ZADHD" values indicate the z-scores of ADHD.
Q: Solve the following problem step by step please A newspaper does a survey of reading preferences…
A: 330=150(survey)+120(read electronic)+50(Physical)+10(do not read any format)
Q: In research about the population of a county with 100,000 inhabitants, a sample of 3000 households…
A: The number of households not willing to participate in the survey is 1200.
Q: During the first 13 weeks of the television season, the Saturday evening 8:00 P.M. to 9:00 P.M.…
A: From the given information, audience proportions were recorded as ABC 29%, CBS 27%, NBC 24% and…
Q: A researcher wants to test whether UBC students are more intelligent than the general population. He…
A: Given: population mean (μ)=100population standard deviation (σ)=15sample size (n)=36Sample mean…
Q: Question 3: The American Association of Individual Investors (AAII) On-Line Discount Broker Survey…
A: Since you have posted a question with multiple sub-parts, we will solve first three sub- parts for…
Q: Question 9 A finance officer for a large company wants to find out an estimate for the percentage of…
A: Given data of number of accounts and number of days overdue as shown below a)The total number of…
Q: In Star Trek, a (fake) element that often plays a role in the plot is dilithium (Dt), which has…
A: To find the weighted atomic mass


Trending now
This is a popular solution!

Step by step
Solved in 3 steps with 3 images

- In general,_____% of the values in a data set lie at or below the 94th percential. _______% of the values in a data set lie at or above the 90th percentile... if a sample consists of 800 test scores,___ of them would be at or below 40th percential, if a sample consists of 800 test scores,____ of then would be at or above the 58th percentile.The trend in home building in recent years has been to emphasize open spaces and great rooms, rather than smaller living rooms and family rooms. A builder of speculative homes in the college community of Oxford, Ohio, had been building such homes, but his homes had been taking many months to sell and had been selling for substantially less than the asking price. In order to determine what types of homes would attract residents of the community, the builder contacted a statistician at a local college. The statistician went to a local real estate agency and obtained the data contained in file OxHome. This data includes the sales price (measured in thousand dollars), square footage, number of rooms, number of bedrooms, and age for each of 60 single-family residences recently sold in the community. Using this data, a regression model was built to predict the sales price of houses in this community. The regression equation from the model is: sales price (thousand dollars) = 19.5 + 0.1079…The trend in home building in recent years has been to emphasize open spaces and great rooms, rather than smaller living rooms and family rooms. A builder of speculative homes in the college community of Oxford, Ohio, had been building such homes, but his homes had been taking many months to sell and had been selling for substantially less than the asking price. In order to determine what types of homes would attract residents of the community, the builder contacted a statistician at a local college. The statistician went to a local real estate agency and obtained the data contained in file OxHome. This data includes the sales price (measured in thousand dollars), square footage, number of rooms, number of bedrooms, and age for each of 60 single-family residences recently sold in the community. Using this data, a regression model was built to predict the sales price of houses in this community. The regression equation from the model is: sales price (thousand dollars) = 19.5 + 0.1079…
- The trend in home building in recent years has been to emphasize open spaces and great rooms, rather than smaller living rooms and family rooms. A builder of speculative homes in the college community of Oxford, Ohio, had been building such homes, but his homes had been taking many months to sell and had been selling for substantially less than the asking price. In order to determine what types of homes would attract residents of the community, the builder contacted a statistician at a local college. The statistician went to a local real estate agency and obtained the data contained in file OxHome. This data includes the sales price (measured in thousand dollars), square footage, number of rooms, number of bedrooms, and age for each of 60 single-family residences recently sold in the community. Using this data, a regression model was built to predict the sales price of houses in this community. The regression equation from the model is: sales price (thousand dollars) = 19.5 + 0.1079…What would be the Herfindahl-Hirschman Index (HHI) in the following situations? A. 10 firms, each with 10 percent of the market. B. 4 firms, each with 25 percent of the market, C. 2 firms, each with 50 percent of the market D. 1 firm with a monopoly in the marketA biologist looked at the relationship between number of seeds a plant produces and the percent of those seeds that sprout. The results of the survey are shown below. Seeds Produced 63 62 43 43 58 59 67 61 Sprout Percent 55.1 62.4 64.1 74.1 63.6 66.3 51.9 64.7 r2r2 = (Round to two decimal places) Interpret r2r2 : Given any group of plants that all produce the same number of seeds, 54% of all of these plants will produce seeds with the same chance of sprouting. There is a 54% chance that the regression line will be a good predictor for the percent of seeds that sprout based on the number of seeds produced. There is a large variation in the percent of seeds that sprout, but if you only look at plants that produce a fixed number of seeds, this variation on average is reduced by 54%. 54% of all plants produce seeds whose chance of sprouting is the average chance of sprouting. The equation of the linear regression line is: ˆyy^ = + xx (Please show your answers to…
- In general, ___________% of the values in a data set lie at or below the 28 th percentile. _______________ % of the values in a data set lie at or above the 90 th percentile.. If a sample consists of 700 test scores, _________of them would be at or below the 52 th percentile. If a sample consists of 700 test scores, ________ of them would be at or above the 64 th percentile.A survey of 40 students at a local college asks, "Where do you buy the majority of your books?" The responses fell into three categories: "at the campus bookstore," "on the Internet," and "other." The results follow. Where Most Books Bought bookstore bookstore Internet other Internet other bookstore other bookstore bookstore bookstore bookstore bookstore other bookstore bookstore bookstore Internet Internet other other other other other other other Internet bookstore other other Internet other bookstore bookstore other bookstore Internet Internet other bookstore Use Excel to estimate the proportion of the college students who buy their books on the Internet. Build a 95% confidence interval for the proportion of students who buy their books on the Internet. Interpret your result. Can we conclude that the proportion of students buy their books on the internet differs from…A friend who lives in Los Angeles makes frequent consulting trips to Washington, D.C.;50% of the time she travels on airline #1, 30% of the time on airline #2, and the remaining 20% of the time on airline #3. For airline #1, flights are late into D.C.30% of the time and late into L.A.10% of the time. For airline #2,these percentages are 25% and 20%,whereas for airline #3 the percentages are 40% and 25%.If we learn that on a particular trip she arrived late at exactly one of the two destinations, what are the posterior probabilities of having flown on airlines #1,#2, and #3? Assume that the chance of a late arrival in L.A.is unaffected by what happens on the flight to D.C. [ Hint: From the tip of each first generation branch on a tree diagram, draw three second-generation branches labeled, respectively, 0 late,1late, and 2 late.]
- For a population with µ = 84 and σ = 4, what is the z-score corresponding to X = 80?The National Highway Association is studying the relationship between the number of bidders on a highway project and the winning (lowest) bid for the project. Of particular interest is whether the number of bidders increases or decreases the amount of the winning bid. Bidders Price 9.0 5.1 9.0 8.0 3.0 9.7 10.0 7.8 5.0 7.7 10.0 5.5 7.0 8.3 11.0 5.5 6.0 10.3 6.0 8.0 4.0 8.8 7.0 9.4 7.0 8.6 7.0 8.1 6.0 7.8 Given: Correlation of Coefficient: 0.7064 (This is correct) Coefficient of determination: 49.90% (This is correct) ŷ = 11.2360 + (-0.4667)x (This is correct) Create a scatter plot of the data Complete a regression analysis of the relationship. Slope = ______ Estimate the winning bid if there were seven bidders. Winning bid cost ______ millions. Compute the 95% prediction interval for a winning bid if there are seven bidders. [ _____________, ______________]The National Highway Association is studying the relationship between the number of bidders on a highway project and the winning (lowest) bid for the project. Of particular interest is whether the number of bidders increases or decreases the amount of the winning bid. Bidders Price 9.0 5.1 9.0 8.0 3.0 9.7 10.0 7.8 5.0 7.7 10.0 5.5 7.0 8.3 11.0 5.5 6.0 10.3 6.0 8.0 4.0 8.8 7.0 9.4 7.0 8.6 7.0 8.1 6.0 7.8 GIVEN: correlation coefficient: - 0.7064 Slope: -0.4667 Coefficient of determination: 49.90% regression equation: ŷ= 11.2360 + (-4467)x FIND: Estimate the winning bid if there were seven bidders. Winning bid cost _________ millions. Explain. Compute the 95% prediction interval for a winning bid if there are seven bidders. [ _______________ , _______________ ] (Explain).