(a) Make a scatterplot that shows how behavior responds to brain activity.

Holt Mcdougal Larson Pre-algebra: Student Edition 2012
1st Edition
ISBN:9780547587776
Author:HOLT MCDOUGAL
Publisher:HOLT MCDOUGAL
Chapter11: Data Analysis And Probability
Section: Chapter Questions
Problem 8CR

Related questions
Question
Can you please help with 4.30 sulfur, the ocean and the sun? Only part A which is make a scatter plot that shows how DMS responds to SRD.
Transcribed Image Text:4.30
lived territorial birds, on the
other hand, the association
is negative because returning
birds claim their territories in
the colony and don't leave room for new recruits.
Which type of species is the sparrowhawk?
Life expectancy of males
Percentile rank
Life expectancy of males
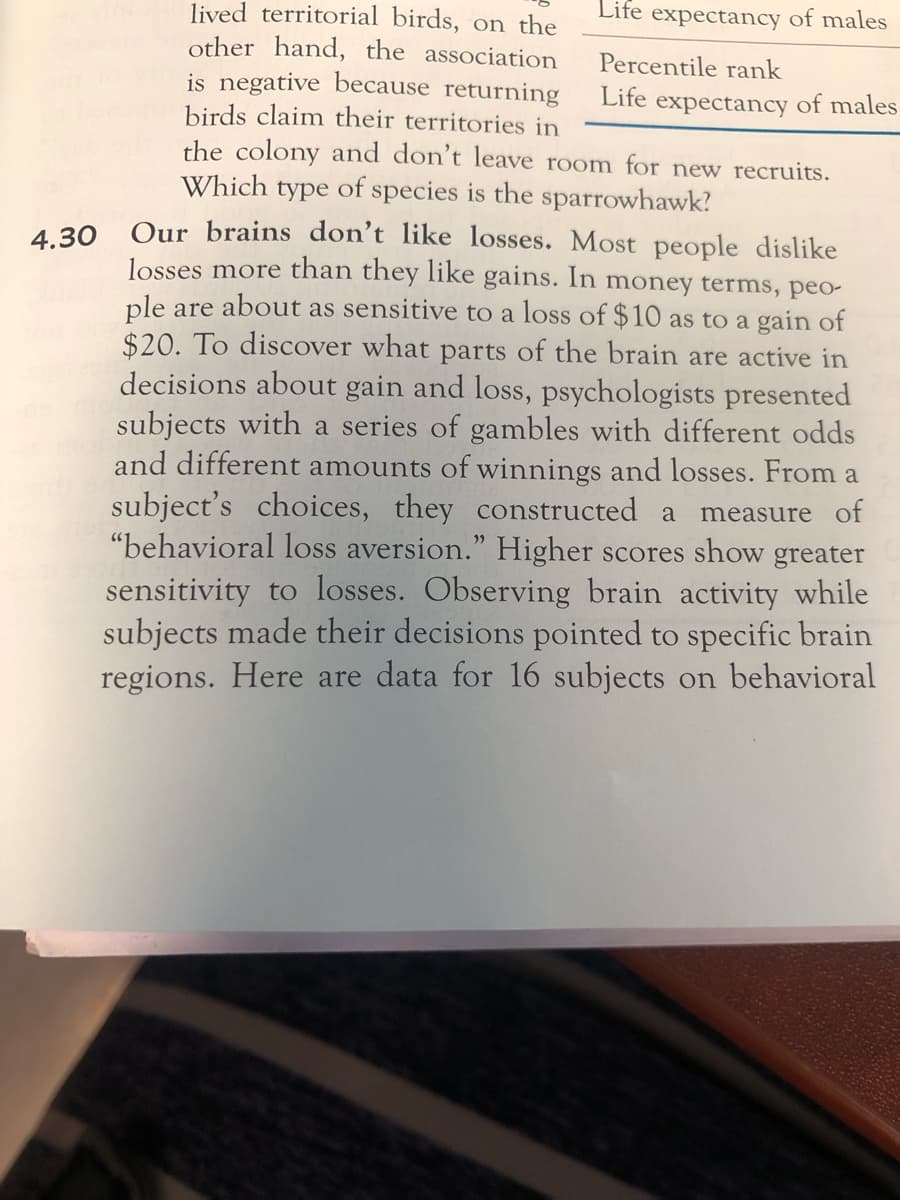
Our brains don't like losses. Most people dislike
losses more than they like gains. In money terms, peo-
ple are about as sensitive to a loss of $10 as to a gain of
$20. To discover what parts of the brain are active in
decisions about gain and loss, psychologists presented
subjects with a series of gambles with different odds
and different amounts of winnings and losses. From a
subject's choices, they constructed a measure of
"behavioral loss aversion." Higher scores show greater
sensitivity to losses. Observing brain activity while
subjects made their decisions pointed to specific brain
regions. Here are data for 16 subjects on behavioral
Transcribed Image Text:ce and time.
Neural
Behavioral
Neural
Behavioral
= in a colony
Age fotostock/Superstock
60 46 38
19 20 20
2.6
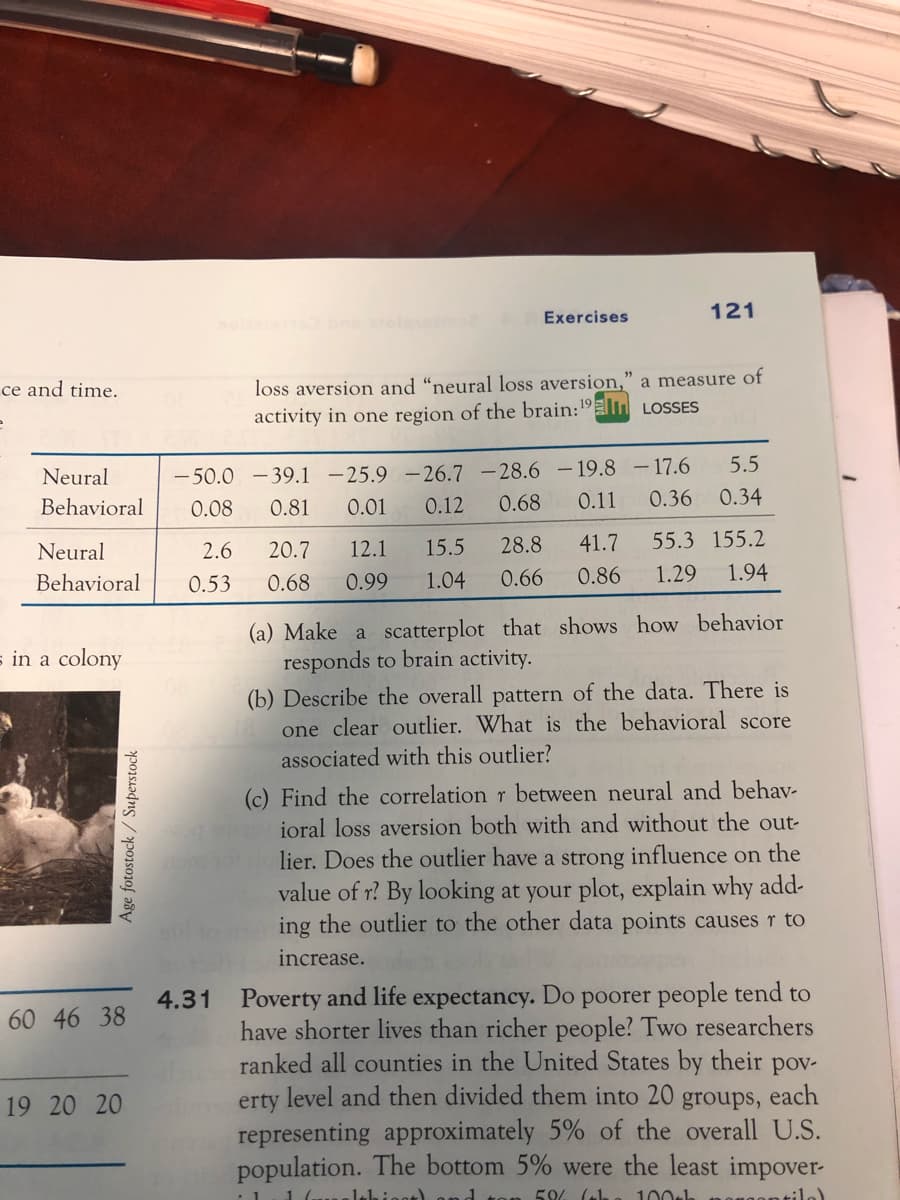
0.53
-50.0 -39.1 -25.9 -26.7 -28.6 -19.8
0.01 0.12 0.68
0.08
0.81
0.11
4.31
loss aversion and "neural loss aversion," a measure of
activity in one region of the brain: 19
LOSSES
20.7
0.68
Exercises
12.1 15.5
0.99
1.04
28.8
0.66
41.7
0.86
121
5.5
0.36 0.34
-17.6
55.3 155.2
1.29
1.94
(a) Make a scatterplot that shows how behavior
responds to brain activity.
(b) Describe the overall pattern of the data. There is
one clear outlier. What is the behavioral score
associated with this outlier?
(c) Find the correlation r between neural and behav-
ioral loss aversion both with and without the out-
lier. Does the outlier have a strong influence on the
value of r? By looking at your plot, explain why add-
ing the outlier to the other data points causes r to
increase.
Poverty and life expectancy. Do poorer people tend to
have shorter lives than richer people? Two researchers
ranked all counties in the United States by their pov-
level and then divided them into 20
erty
each
groups,
representing approximately 5% of the overall U.S.
population. The bottom 5% were the least impover-
1 (alchigar) and top 5% (the 100tk
montile)
Expert Solution
This question has been solved!
Explore an expertly crafted, step-by-step solution for a thorough understanding of key concepts.

Step by step
Solved in 2 steps with 1 images

Recommended textbooks for you
Holt Mcdougal Larson Pre-algebra: Student Edition…
Algebra
ISBN:
9780547587776
Author:
HOLT MCDOUGAL
Publisher:
HOLT MCDOUGAL

Glencoe Algebra 1, Student Edition, 9780079039897…
Algebra
ISBN:
9780079039897
Author:
Carter
Publisher:
McGraw Hill
Holt Mcdougal Larson Pre-algebra: Student Edition…
Algebra
ISBN:
9780547587776
Author:
HOLT MCDOUGAL
Publisher:
HOLT MCDOUGAL
Glencoe Algebra 1, Student Edition, 9780079039897…
Algebra
ISBN:
9780079039897
Author:
Carter
Publisher:
McGraw Hill