A male child is 19 inches long at birth and grows to an adult height of 73 inches. In this exercise, we make a logistic model of his height as a function of age. (a) Use the given information to find K and b for the logistic model. (Round b to two decimal places.) (b) Suppose he reaches 91% of his adult height at age 16. Use this information and that from part (a) to find r. (Suggestion: Vou will need to use either the crossing-graphs method or some algebra involving the logarithm. Round r to three decimal places.) (e) Make a logistic model for the height H, in inches, as a function of the age r, in years. H(t) = (d) According to the logistic model, at what age is he growing the fastest? (Round your answer to two decimal places.) years old
A male child is 19 inches long at birth and grows to an adult height of 73 inches. In this exercise, we make a logistic model of his height as a function of age. (a) Use the given information to find K and b for the logistic model. (Round b to two decimal places.) (b) Suppose he reaches 91% of his adult height at age 16. Use this information and that from part (a) to find r. (Suggestion: Vou will need to use either the crossing-graphs method or some algebra involving the logarithm. Round r to three decimal places.) (e) Make a logistic model for the height H, in inches, as a function of the age r, in years. H(t) = (d) According to the logistic model, at what age is he growing the fastest? (Round your answer to two decimal places.) years old

Chapter6: Exponential And Logarithmic Functions
Section6.8: Fitting Exponential Models To Data
Problem 2TI: Sales of a video game released in the year 2000 took off at first, but then steadily slowed as time...

Related questions

Concept explainers
Contingency Table
A contingency table can be defined as the visual representation of the relationship between two or more categorical variables that can be evaluated and registered. It is a categorical version of the scatterplot, which is used to investigate the linear relationship between two variables. A contingency table is indeed a type of frequency distribution table that displays two variables at the same time.
Binomial Distribution
Binomial is an algebraic expression of the sum or the difference of two terms. Before knowing about binomial distribution, we must know about the binomial theorem.
Topic Video
Question
5
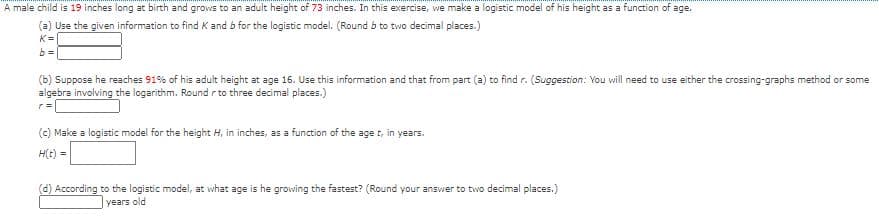
Transcribed Image Text:A male child is 19 inches long at birth and grows to an adult height of 73 inches. In this exercise, we make a logistic model of his height as a function of age.
(a) Use the given information to find K and b for the logistic model. (Round b to two decimal places.)
K=
b =
(b) Suppose he reaches 91% of his adult height at age 16. Use this information and that from part (a) to find r. (Suggestion: You will need to use either the crossing-graphs method or some
algebra involving the logarithm. Round r to three decimal places.)
(c) Make a logistic model for the height H, in inches, as a function of the age t, in years.
H(t) =
C) According to the logistic model, at what age is he growing the fastest? (Round your answer to two decimal places.)
years old
Expert Solution
This question has been solved!
Explore an expertly crafted, step-by-step solution for a thorough understanding of key concepts.

This is a popular solution!

Trending now
This is a popular solution!

Step by step
Solved in 2 steps with 1 images

Knowledge Booster


Learn more about
Need a deep-dive on the concept behind this application? Look no further. Learn more about this topic, advanced-math and related others by exploring similar questions and additional content below.Recommended textbooks for you

Algebra & Trigonometry with Analytic Geometry
Algebra
ISBN:
9781133382119
Author:
Swokowski
Publisher:
Cengage

College Algebra (MindTap Course List)
Algebra
ISBN:
9781305652231
Author:
R. David Gustafson, Jeff Hughes
Publisher:
Cengage Learning
Algebra & Trigonometry with Analytic Geometry
Algebra
ISBN:
9781133382119
Author:
Swokowski
Publisher:
Cengage
College Algebra (MindTap Course List)
Algebra
ISBN:
9781305652231
Author:
R. David Gustafson, Jeff Hughes
Publisher:
Cengage Learning